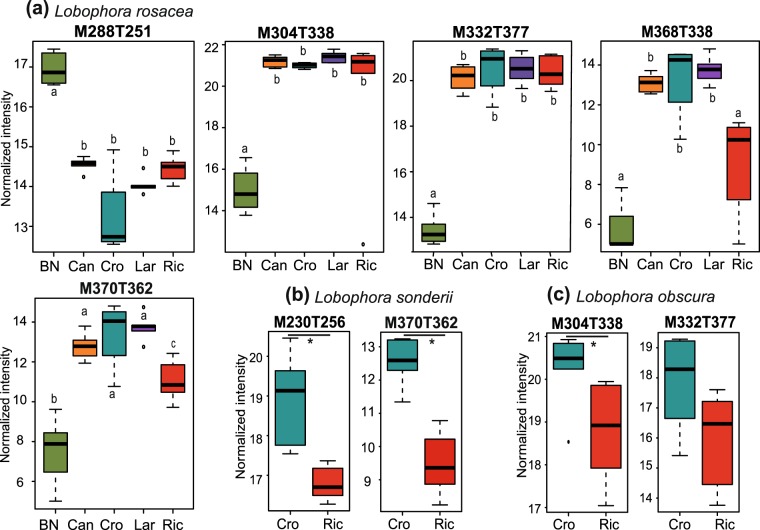
Figure 4.
Box plots of the chemomarkers annotated in Lobophora species responsible for metabolomic differences according to sites. Ion intensities of chemomarkers are expressed as mean normalized intensities ± SD (log-transformed data). For (a) Lobophora rosacea: n = 6 for Banc Nord (BN), Canard (Can) and Ricaudy (Ric), n = 5 for Larégnère (Lar) and n = 4 for Crouy (Cro). Statistical analyses were performed using Kruskal-Wallis (KW) followed by post-hoc Conover’s test. Letters represent distinct groups based on post-hoc pairwise comparisons between sites for each chemomarker (p < 0.05). Compounds M230T256, M242T309, M258T310 and M344T346 are shown in Fig. S4 and present the same trend as M332T377. For (b) Lobophora sonderii and (c) Lobophora obscura: n = 6 and differences between ion intensities at Crouy vs Ricaudy were tested with Mann-Whitney tests (*p < 0.01). Compounds M258T310 and M368T338 of Lobophora sonderii are shown in Fig. S4 and present the same trend as M370T362.

