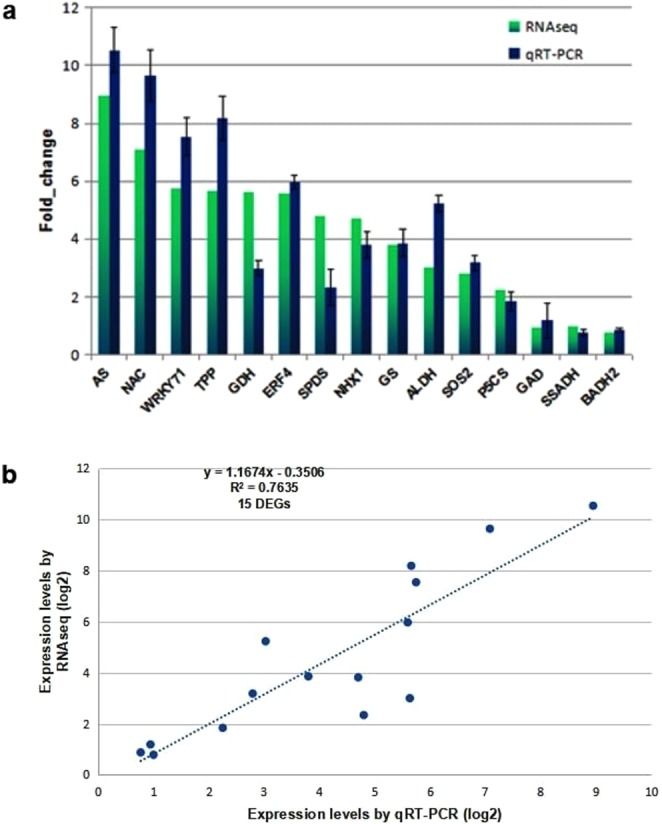
Figure 4.

(a) qRT-PCR of selective up-regulated genes under 1 M salt treatment in P. odorifer (Legend:- AS: Asparagine synthetase, NAC: NAC TF, WRKY71: WRKY TF 71, TPP: Trehalose phosphate phosphatase, GDH: Glutamate dehydrogenase, ERF4: Ethylene responsive factor 4, SPDS: Spermidine synthase, NHX1: Na +/H + antiporter 1, GS: Glutamine synthetase, ALDH: Aldehyde dehydrogenase, SOS2: Salt overly sensitive-2, P5CS: 1-pyrroline 5 carboxylate synthase, GAD: glutamate decarboxylase, SSADH: Succinic semialdehyde dehydrogenase, BADH2: Betaine aldehyde dehydrogenase 2). (b) Scatter plot depicting the correlation between the RNAseq and qRT-PCR data. The figure shows expression changes (log2 fold) measured by RNAseq and qRT-PCR analyses of the selected genes. A linear trend line is shown.
