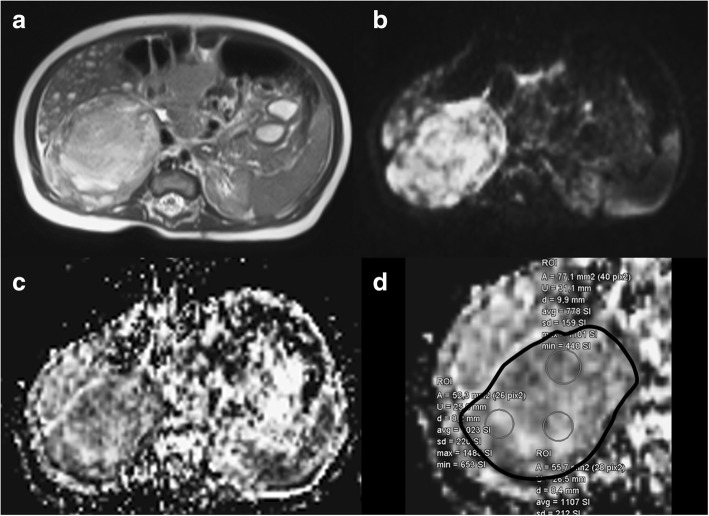
Fig. 3.
Baseline MRI of a 16-month-old boy with neuroblastoma of the left adrenal gland and suspected liver metastases (liver lesions not shown). The tumour signal is notably more heterogeneous than that of the lesion shown in Fig. 2 and comprises some high-signal areas on the T2-weighted image (a). In b, a high signal on DWI (b = 800 s/mm2) can be appreciated while a low signal is visible on the ADC map (c) is, however, predominant within the tumour. The presented cross-sectional image was chosen for analysis, as the cross section at the largest tumour diameter included a higher proportion of heterogeneous tumour signal. The black solid line overlay on the magnified ADC map highlights the large ROI drawn for study purposes (d). Mean baseline ADC was measured as 0.706 × 10⁻³ mm2/s in this eventually relapsing tumour. Three small ROIs yield ADC values of 0.589, 0.638, and 2.841 × 10⁻³ mm2/s, the latter equalling liquefied tumour necrosis

