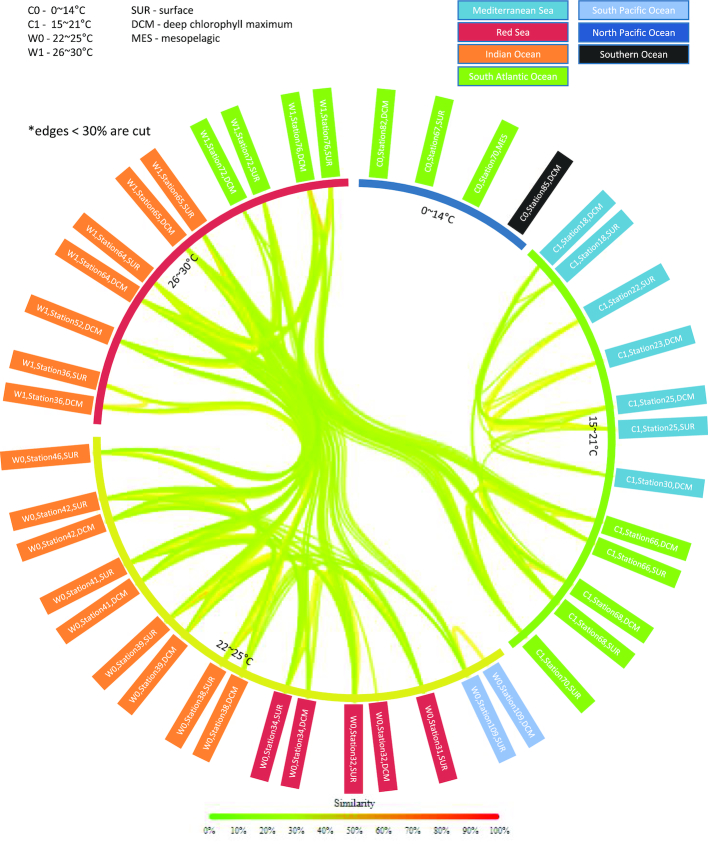
Figure 5:
Visualizing the genetic distance among marine viral communities using Libra. Similarities between samples from 43 TOV from the 2009–2012 Tara Oceans Expedition. Lines (edges) between samples represent the similarity and are colored and thickened accordingly. Lines with insignificant similarity (less than 30%) are removed. Each of the sample names is color coded by Longhurst Province. Inner circles show temperature ranges. Sample names show the temperature range, station, and depth as indicated on the legend. The analysis is performed using Libra (k = 20, Logarithmic weighting, and Cosine Similarity).

