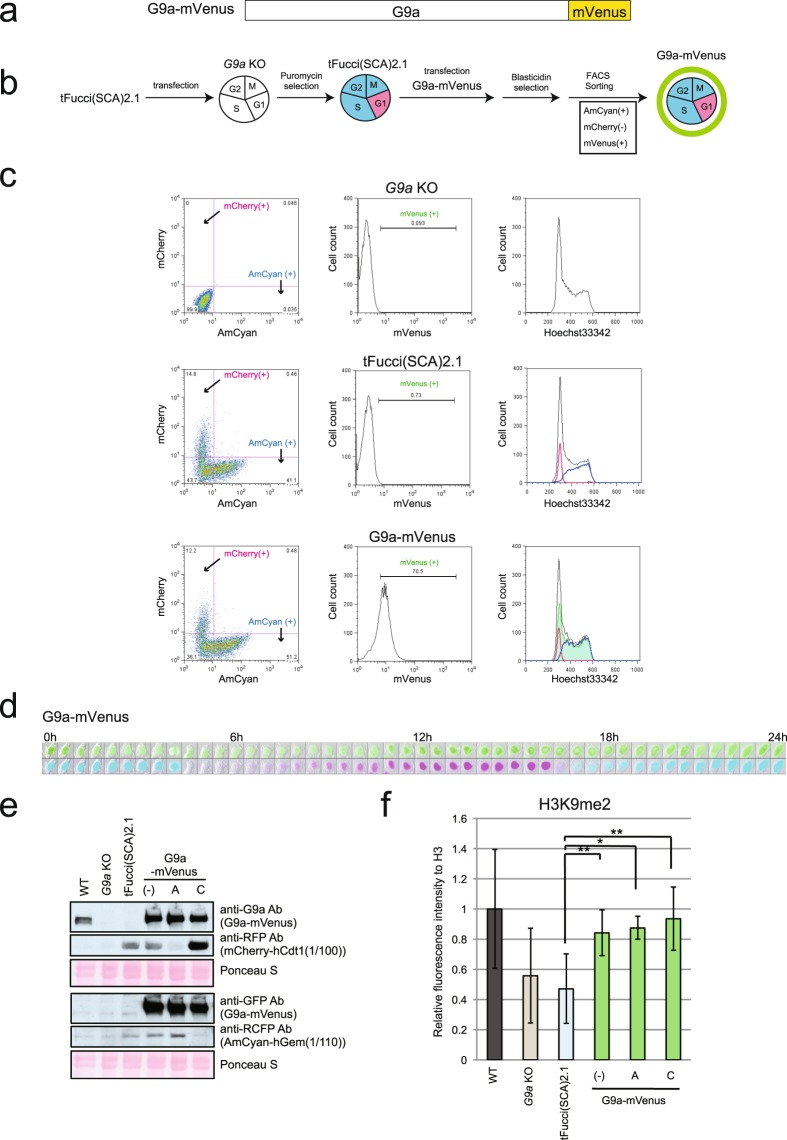
Figure 2.
Establishment of G9a KO iMEFs expressing G9a-mVenus. (a) Construction of G9a-mVenus. G9a was fused to mVenus at the C-terminus. (b) Strategy for the establishment of the G9a KO iMEFs expressing G9a-mVenus. (c) FACS analysis of the expression of mCheery and AmCyan (left panels), mVenus (middle panels), and DNA contents (right panels). Black line: total cells, blue line: AmCyan (+) cells, red line: mCherry (+) cells and green line: mVenus(+). (d) The cell line expressing G9a-mVenus was live imaged by LCV110. The images were excerpts taken during the first 24 h. mVenus (upper panels), and AmCyan and mCherry (lower panels) are showed in combination in bright field images. They were photographed every 30 min. e) G9a-mVenus protein was detected using anti-G9a antibody and anti-GFP antibody by western blot. mCherry and AmCyan also was detected using to confirmation of the sorting specificity. (−): total cells, A: AmCyan (+) sorted cells, C: mCherry (+) sorted cells. (f) H3K9me2 level was determined by western blot using Odyssey CLs. The means of relative fluorescence intensity to H3 is shown in the graphs. N = 3, independent experiments. Original images are shown in Fig. S3. Error bars indicate ± SD *p < 0.05 and **p < 0.01 by Student’s t-test. Compared to WT, G9a KO and tFucci(SCA)2.1 showed statistically significant differences (p < 0.05).

