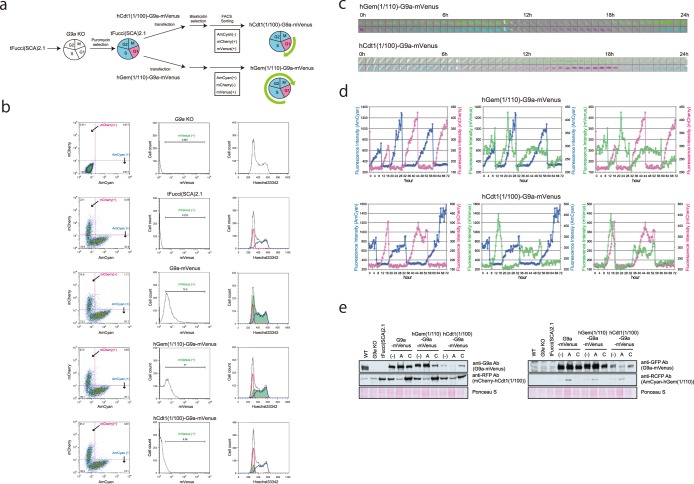
Figure 4.
Establishment of G9a KO iMEFs expressing G9a-mVenus that was degraded in a specific phase of the cell cycle. (a) Strategy for the establishment of G9a KO iMEF expressing hGem(1/110)-G9a-mVenus and hCdt1(1/100)-G9a-mVenus (Fig. 3a). (b) The established cell lines were stained by Hoechst 33342 and analyzed using a FACSAria SORP apparatus. Black line: total cells, blue line: AmCyan (+) cells, red line: mCherry (+) cells and green line: mVenus (+). (c) The established cell lines were analyzed for live cell imaging for fluorescent signals. The images were excerpted during the first 24 h. mVenus (upper panels), and AmCyan and mCherry (lower panels) are shown in combination using bright field microscopy. They were photographed every 30 min. (d) Fluorescence intensities are indicated in the line graphs. Blue line: AmCyan, red line: mCherry, and green line: mVenus. (e) The expression of G9a-mVenus protein was determined by western blot. mCherry and AmCyan were also determined to confirm the sorting specificity. (−) Total cells, A: AmCyan (+) sorted cells, and C: mCherry (+) sorted cells.

