Figure 5.
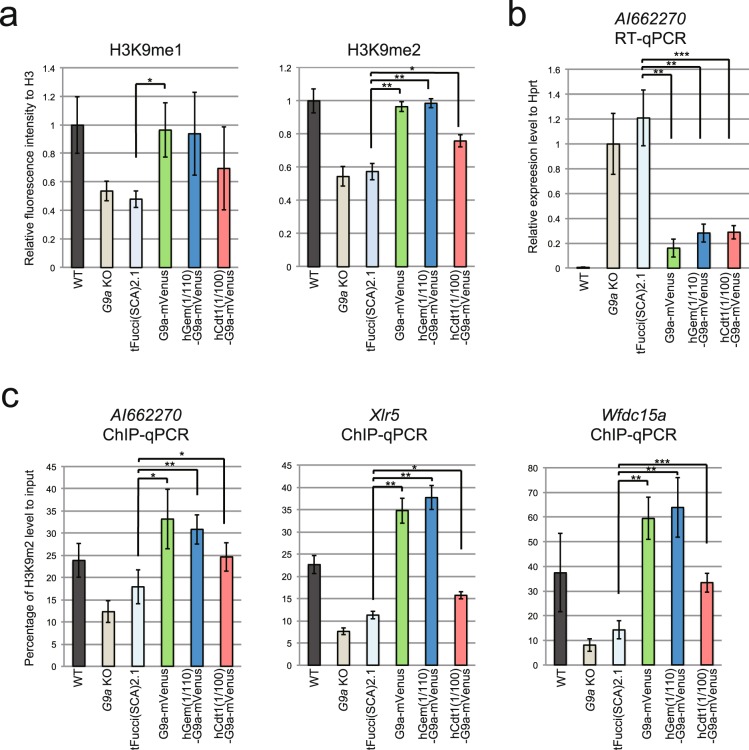
Profiling of G9a function in the cell cycle. (a) H3K9me1 and me2 levels were determined by western blot analysis using Odyssey CLs. The means of relative fluorescence intensity to H3 are shown in the graphs. me1: N = 3, me2: N = 4, independent experiments. Error bars indicate ± SD. *p < 0.05, **p < 0.01 and ***p < 0.001 by Student’s t-test. Compared to WT, G9a KO and tFucci(SCA)2.1 showed statistically significant differences (p < 0.05) for both H3K9me1 and me2. Original images are shown in (Fig. S3). (b) G9a target gene, AI662270 mRNA level was measured by quantitative RT-PCR. The mean values show the relative expression level to Hprt. N = 4, independent experiments. Compared to WT, all other samples showed statistically significant differences (p < 0.05). (c) ChIP analysis for H3K9me2. Upstream of AI662270, Xlr5 and Wfdc15a were measured by quantitative PCR. AI662270: N = 5, Xlr5 and Wfdc15a:N = 4 independent experiments. The mean values show percentage of H3K9me2 level to input. Compared to WT, G9a KO and hGem(1/110)-G9a-mVenus for AI662270, G9a KO and tFucci(SCA)2.1 for Xlr5 and Wfdc15a showed statistically significant differences (p < 0.05).

