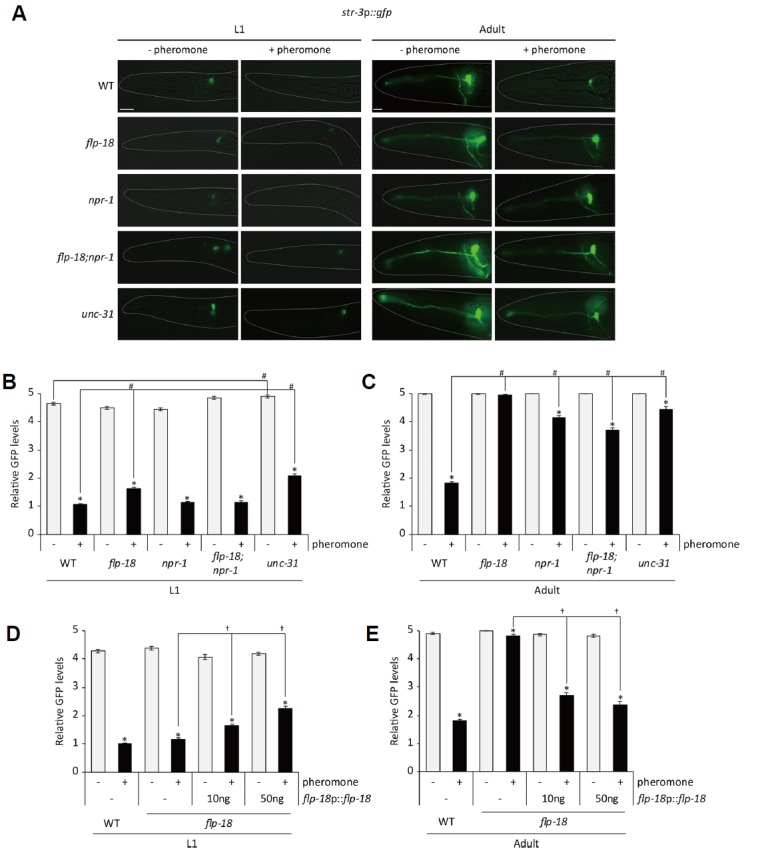
Fig. 4. FLP-18 neuropeptide and NPR-1 neuropeptide receptor are required for pheromone-mediated str-3 repression.

(A) Representative images of flp-18, npr-1, and flp-18;npr-1 mutants expressing the str-3p::gfp transgene in the ASI neurons at the L1 (left two panels) and adult stage (right two panels) upon exposure to mixtures of 1 μM ascaroside pheromone. (B–C) Relative GFP levels of str-3p::gfp expression in flp-18, npr-1, and flp-18;npr-1 mutants at the L1 (B) and adult stage (C) upon exposure to mixtures of 1 μM ascaroside pheromone. (D–E) Relative GFP levels of str-3p::gfp expression in flp-18 mutants expressing flp-18 genomic DNA driven by its own promoter upon exposure to mixtures of 1 μM ascaroside pheromone. n≥ 30 for each. Error bars represent the SEM. *, #, and † indicate different from the controls (absence of pheromone, wild-type animals, and no transgene, respectively) at P < 0.001 (Bonferroni t -test). The scale bar represents 10 μm.
