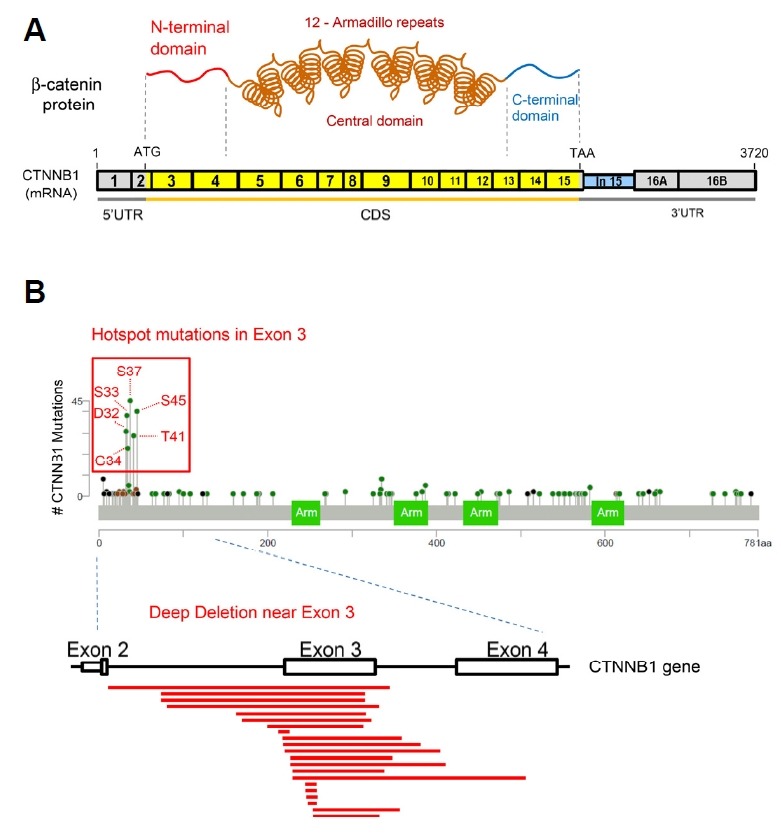
Fig. 3. Diagram of β-catenin protein domains and hotspot mutations.

(A) A schematic diagram of the β-catenin protein and mRNA. UTR, untranslated region; CDS, coding sequence; ATG, translation start codon; TAA, translation stop codon. (B) Exon 3 hotspot mutations of CTNNB1 are marked on the lollipop plot downloaded from the MSK-IMPACT pan-cancer study on cBioportal. Deep deletions near Exon 3 of CTNNB1 pre-mRNA are indicated as red lines. Deletion data were obtained from metastatic colorectal cancer study (MSK) on cBioportal.
