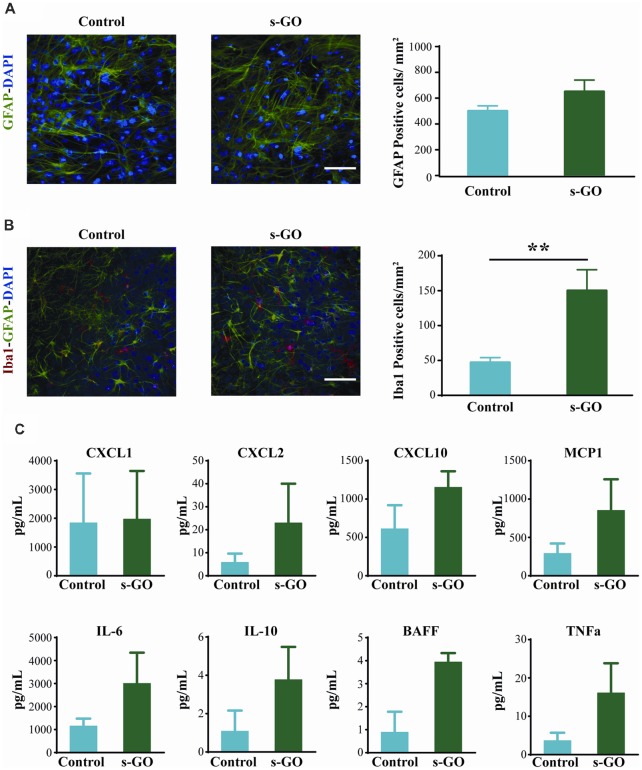
Figure 3.
Tissue reactivity in organotypic spinal cultures exposed to s-GO at high dose. In (A), GFAP immune-labeling to visualize astrocytes in Control and s-GO treated slices (50 μg/mL). Both cultures were labeled for GFAP (in green) and nuclei (DAPI; in blue) Scale bar 100 μm. Note that the GFAP+ cell density did not differ between the two conditions (column plot). In (B), immunofluorescence images are shown to visualize glial and microglial cells in Control and s-GO (50 μg/mL) treated slices (anti-Iba1, in red; anti-GFAP in green; DAPI in blue). Scale bar 50 μm. Note that Iba1+ cell density was significantly (**P < 0.01) increased by s-GO (50 μg/mL; right column plot). (C) Plots summarize the Milliplex assay measures to assess the production of the following cytokines in organotypic culture supernatant: IL6, IL10, TNFα and BAFF and chemokines: CXCL1, CXCL2, CXCL10 and MCP1 in the presence or absence of s-GO, after 2 weeks in vitro. Column graphs report mean values ± SEM of five independent experiments.

