Figure 4.
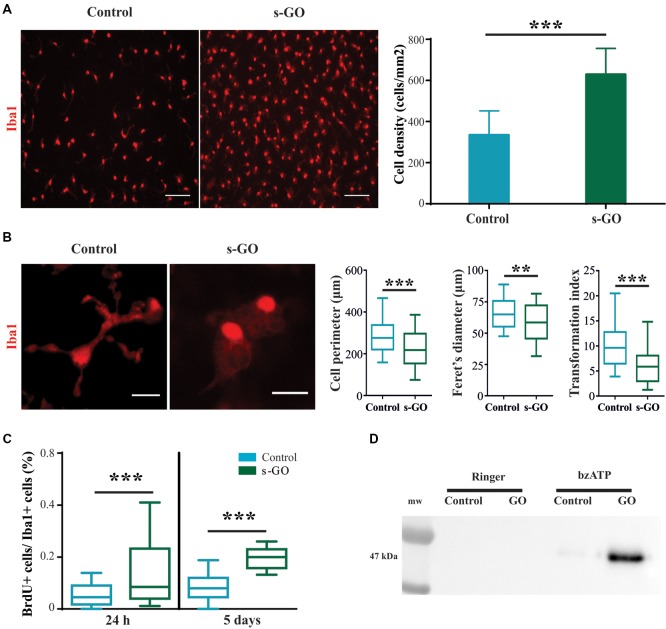
Increased cell reactivity in pure microglia cell cultures exposed to s-GO. In (A), immunofluorescence micrographs visualize microglia by Iba1 labeling (in red) in Control and s-GO treated cultures (10 μg/mL). Scale bar 50 μm. The column graph summarizes microglial density in the two conditions. Note that Iba1+ cell density is significantly (***P < 0.001) higher in cultures treated by s-GO. In (B), high magnification confocal micrographs of Iba1+ cells highlight their morphology in the two conditions. The right column plots summarizes perimeter, Ferret’s maximum diameter and transformation index, parameters that describe cellular ramification. All of them are significantly reduced after s-GO exposure (***Pperimeter < 0.0001, **PFeret’s diameter < 0.001, ***Ptransformation index < 0.0001; Mann-Whitney test). In (C), box plots show the bromodeoxyuridine (brdU+)/Iba1+ ratio measured in isolated microglial cultures 24 h and 5 days after s-GO exposure (10 μg/mL; ***P < 0.001). In (D), western blot analysis of the Microvesicles (MVs) marker flotillin-1 in each condition. MVs were isolated from glial cultures incubated with s-GO (10 μg/mL) for 6 days and then treated or not with benzoyl-ATP (bzATP).

