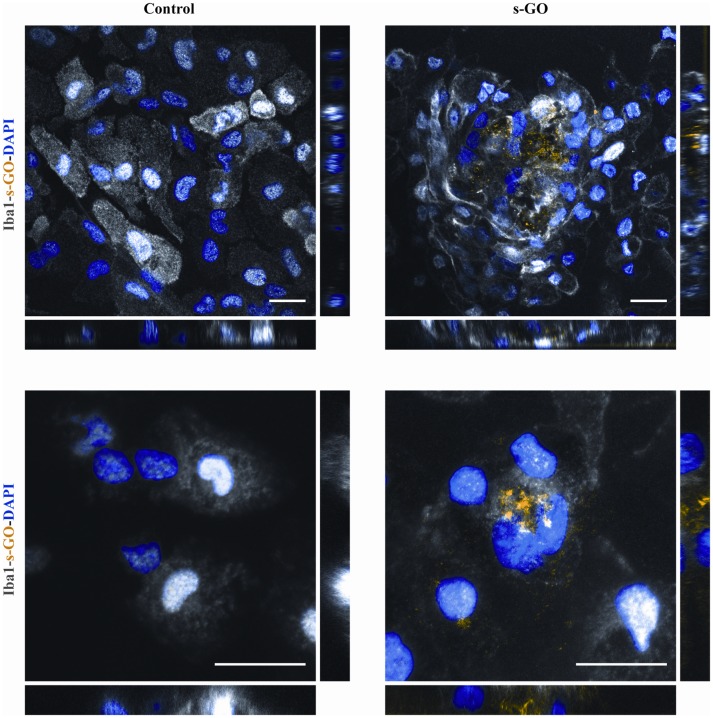
Figure 5.
s-GO activates microglia phagocytosis in pure neuroglia cultures. Representative confocal reconstruction of microglial cells in Control or s-GO (10 μg/mL) treated cultures. Scale bar 20 μm. In the bottom panel, for both conditions a 60× zoom (50 × 50 μm field) of a single microglial cell is shown. Scale bar 20 μm. Cultures are immunostained for Iba1 (in gray), and DAPI (in blue), s-GO is visualized by the reflection mode of the confocal system (in yellow). s-GO sheets are visible as aggregates colored in yellow inside the cell.

