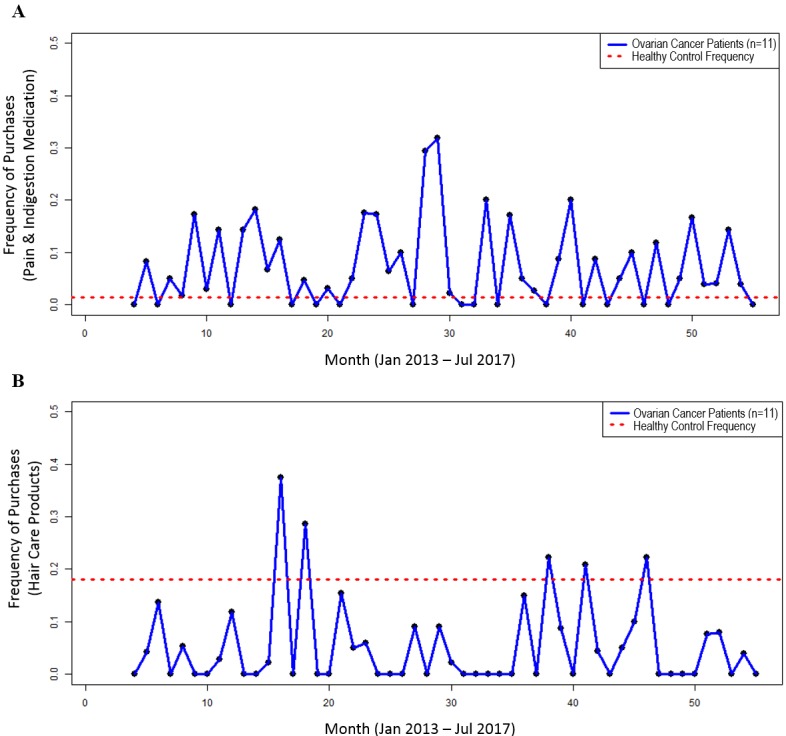
Figure 1.

Overall purchase proportions. For each month between April 2013 and July 2017, the total purchases for each category were summed and divided by the number of all purchases in that month for the ovarian cancer patients (blue line), compared with the average monthly purchase proportion for that category for the healthy control subject (red dotted line). A. Purchases of pain and indigestion medication. B. Purchases of hair care products.
