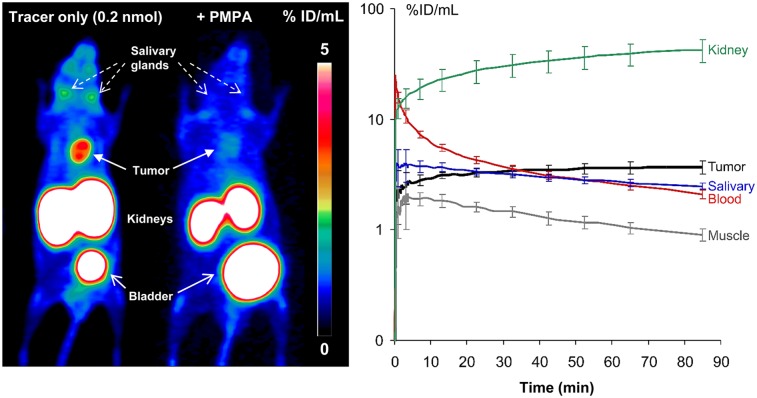
FIGURE 3.
(Left) 68Ga-PSMA-I&F PET of LNCaP xenograft–bearing SHO mice (maximum-intensity projection, static scan, 1 h after injection) without (left mouse) or with (right mouse) coinjection of excess 2-PMPA. (Right) Time–activity curves for selected organs 0–90 min after injection of 68Ga-PSMA-I&F (0.2 nmol) in LNCaP xenograft–bearing SHO mouse.

