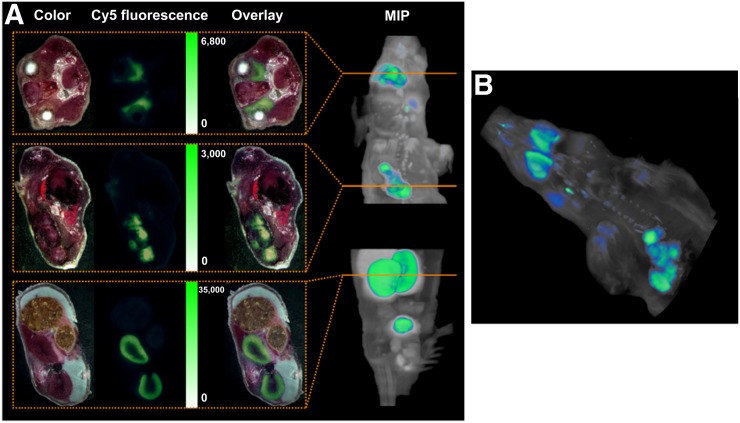
FIGURE 4.
(A) Color and fluorescence images of whole-body cryosections of LNCaP xenograft–bearing SHO mouse 1 h after injection of 2 nmol natGa-PSMA-I&F. (Top) Representative section of salivary glands. (Middle) Representative section of tumor region. (Bottom) Representative section of kidneys. Please note that images are scaled to same visual intensity. On right, the maximum-intensity projection (MIP) is at xz plane. Orange lines correspond to exact locations of representative sections shown to left. (B) Three-dimensional rendering of Sulfo-Cy5 fluorescence images obtained for consecutive 2-dimensional whole-body cryosections (as in B) of LNCaP xenograft–bearing SHO mouse 1 h after injection of 2 nmol natGa-PSMA-I&F.

