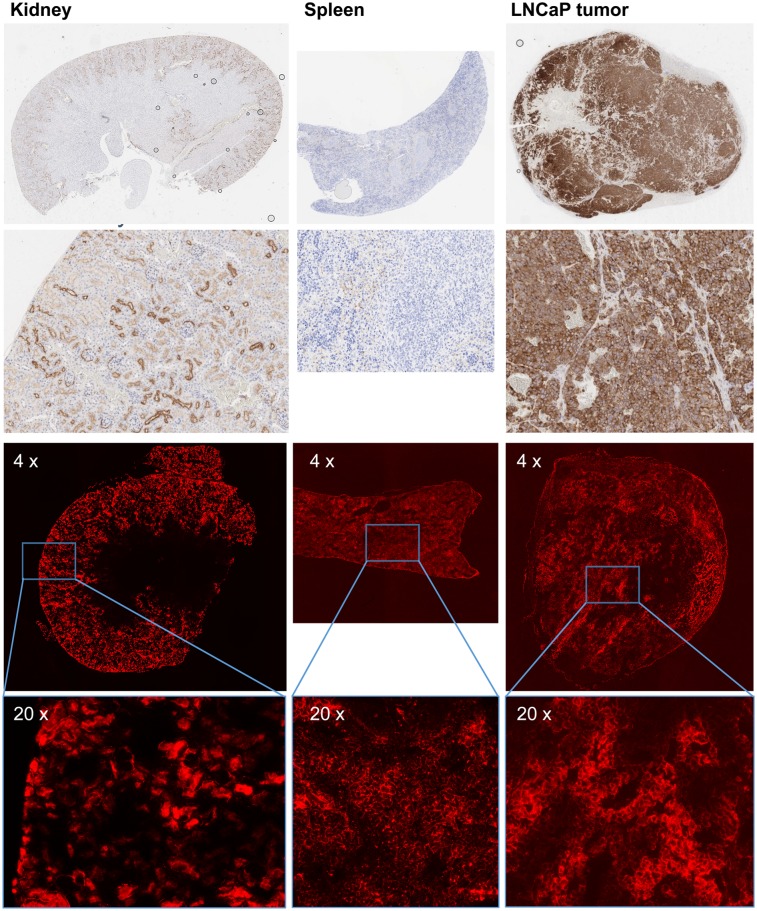
FIGURE 5.
(Top 2 rows) PSMA immunohistochemistry of mouse tissue sections (paraffin embedded, 2 μm): first row, whole organ; second row, kidney and tumor 10× magnification and spleen 20× magnification. (Bottom 2 rows) Tissue distribution of PSMA-I&F (2 nmol, 1 h after injection) observed by Sulfo-Cy5 fluorescence microscopy of mouse tissue cryosections (10 μm): third row, 4× magnification; fourth row, 20× magnification. Please note that images have been scaled to comparable visual fluorescence intensity. Exposition times during fluorescence microscopy: 2 s for kidney, 12 s for spleen and tumor, respectively.

