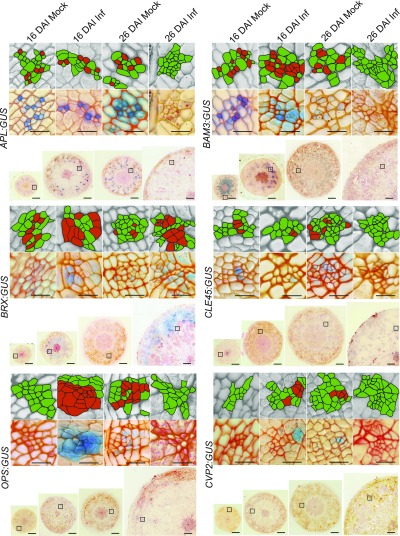
Figure 2.
Promoter Activity of Genes Involved in Phloem Differentiation.
Comparison of the APL:GUS; BAM3:GUS; BRX:GUS; CLE45:GUS; OPS:GUS; CVP2:GUS promoter activity at indicated time (16 DAI or 26 DAI) in mock inoculated plants (Mock) or after P. brassicae infection (Inf). Signals were observed as a blue product of β-Glucuronidase activity in 10-µm Technovit embedded and Safranin-O counterstained hypocotyl sections. Due to the large size of the galls at 26 DAI, a quarter segment of the representative section for each hypocotyl is presented. Insets show representative phloem bundle images from regions marked with squares on the whole section images. Each inset is duplicated in the upper grayscale panel; the phloem cells are highlighted for the corresponding GUS staining image beneath it. Those phloem cells stained for promoter activity are marked in red and other phloem cells, not showing GUS staining, are marked in green. Scale bars represent 200 µm for radial sections and 20 µm for the insets provided. The experiment was performed on 30 plants for each combination and repeated three times. After visual inspection, the 10 most representative hypocotyls from each combination were used for sectioning.

