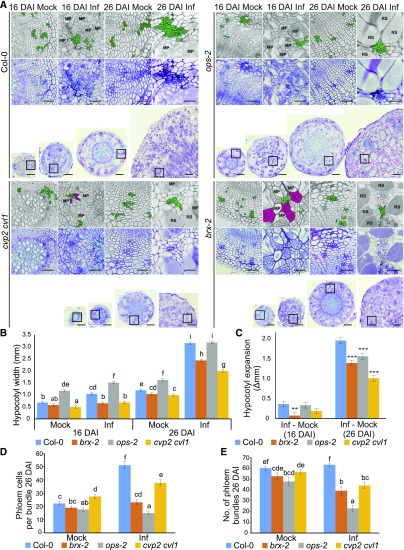
Figure 3.
Disease Development In Galls Of Phloem Differentiation Mutant Plants.
(A) Representative 10-µm sections across hypocotyls of Col-0 and selected phloem differentiation mutants: brx, ops, and cvp2 cvl1 at 16 DAI and 26 DAI. Sections were stained using toluidine blue. Scale bars represent 200 µm for radial sections and 50 µm for the insets provided. Insets show higher magnification of regions containing phloem cells. Each inset is duplicated in the upper grayscale panel; the phloem cells are highlighted in green. Clusters of undifferentiated cells observed in hypocotyls of infected brx and cvp2 cvl1 mutants are colored magenta.
MP, multinuclear plasmodia; RS, resting spores.
(B) The influence of phloem differentiation mutants on P. brassicae gall development 16 DAI and 26 DAI. Hypocotyl widths were measured and the means and ses of 15 replicates were calculated using a general linear model, different letters indicate a significant difference between means (Benjamini-Hochburg adjusted P < 0.05).
(C) The P. brassicae-induced increase in hypocotyl width calculated from (B) is plotted; asterisks denote a significant difference between mutant and wild type (*P < 0.05, **P < 0.01, ***P < 0.001).
(D) The number of phloem cells per bundle based on calculations performed on three randomly chosen bundles from 10 independent hypocotyls for each combination (30 bundles in total).
(E) The number of phloem bundles per hypocotyl observed on 10 independent hypocotyls for each combination.

