Figure 6.
Changes in Carbohydrate and Sucrose Distribution Observed in Col-0 and the sweet11;12 Double Mutant.
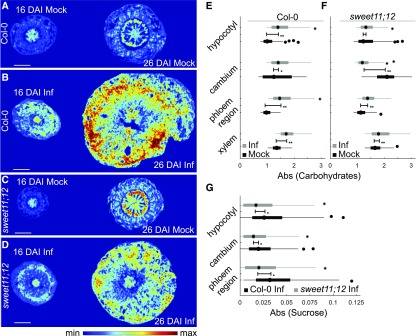
(A) to (D) FTIR visualization of carbohydrate levels within the hypocotyls of Col-0 (A and B) and sweet11;12 (C and D) plants at indicated time (16 DAI and 26 DAI) with (Inf) and without (Mock) P. brassicae infection. Scale bar represents 400 μm.
(E) and (F) Differences in carbohydrate distribution changes that occurred over 10 d (from 16 DAI to 26 DAI) in Col-0 (E) and sweet 11;12 (F) plants. Values were calculated for whole radial hypocotyl sections or extracted from digitally selected cambium, phloem, and xylem regions of Mock and Inf plants at 16 DAI and 26 DAI.
(G) Quantification of changes in sucrose concentration observed with FTIR imaging between two time-points (16 DAI and 26 DAI) after P. brassicae infection, averaged for three individual plants of Col-0 and sweet11;12. Boxplot graphs show median values as a point and inter-quartile range (IQR) as a box, with whiskers representing 1.5× IQR. The error bar represents the variation between the two distributions as quantile absolute difference (QAD). Significant differences with Mann-Whitney P values below 0.05 are marked * and ** when the Divergence Effect Size > 0.2. Spectral features of carbohydrates or sucrose fingerprints along with baseline features were extracted using an extended multiplicative signal correction model (see “Methods”).

