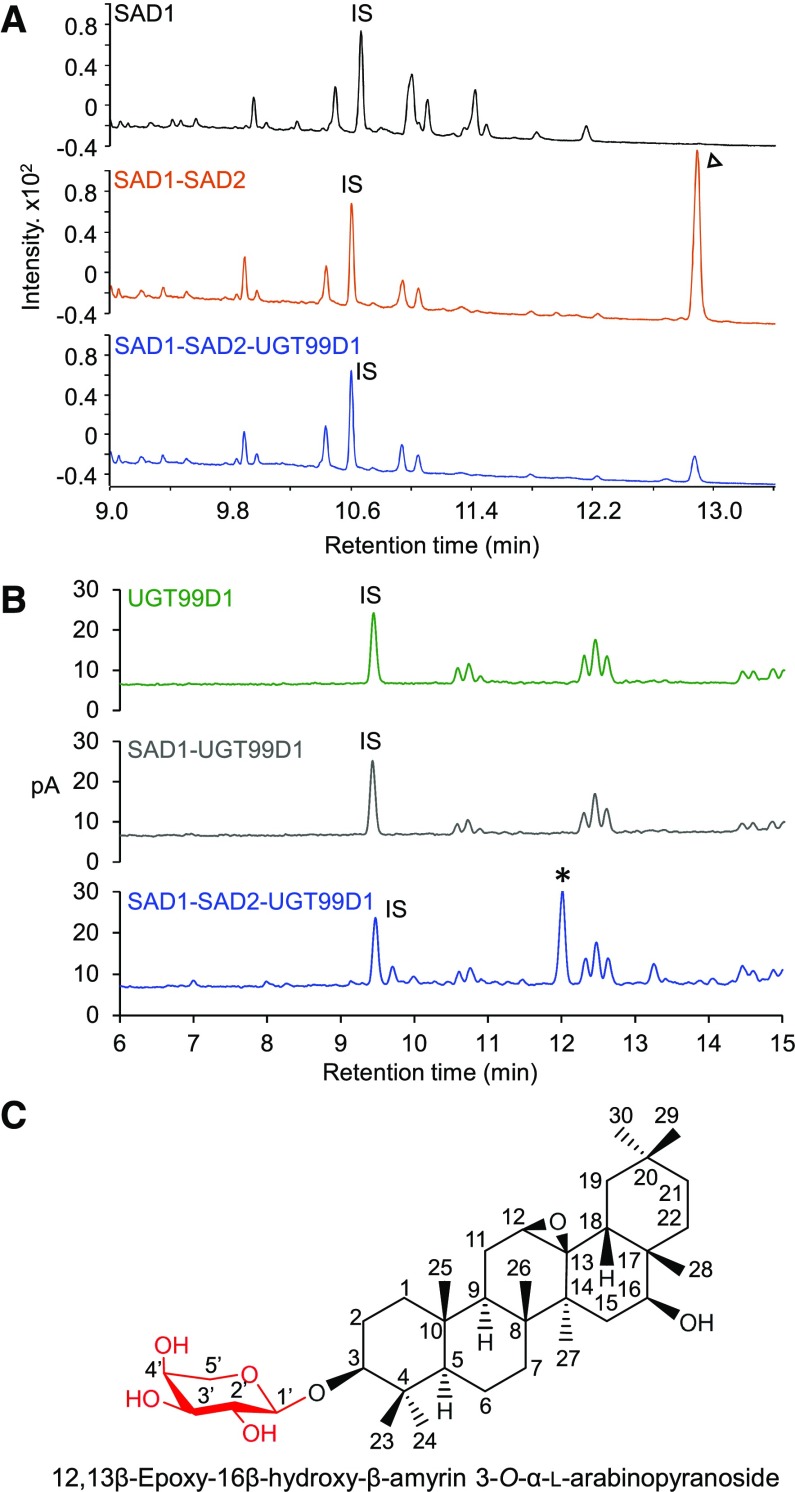
Figure 4.
Transient Expression of AsAAT1 in N. benthamiana
(A) GC-MS analysis of extracts from agro-infiltrated N. benthamiana leaves. Comparison of the metabolite profiles of leaves expressing SAD1 and SAD2 (red) or SAD1, SAD2, and UGT99D1 (blue). EpHβA, identified previously as the coexpression product of SAD1 and SAD2, is indicated by an arrowhead (Geisler et al., 2013). The upper chromatogram consists of a control from leaves expressing GFP only (black).
(B) HPLC with CAD chromatograms of extracts from N. benthamiana leaves expressing UGT99D1 alone (green), SAD1 and UGT99D1 (gray), and SAD1, SAD2, and UGT99D1 together (blue). The new compound that accumulated in the latter (tR 12.0 min) is indicated by an asterisk. This compound was not detected when UGT99D1 was expressed on its own or with SAD1. The IS was digitoxin (1 mg/g of dry weight).
(C) Structure of the UGT99D1 product (see Supplemental Figure 4 for NMR assignment).

