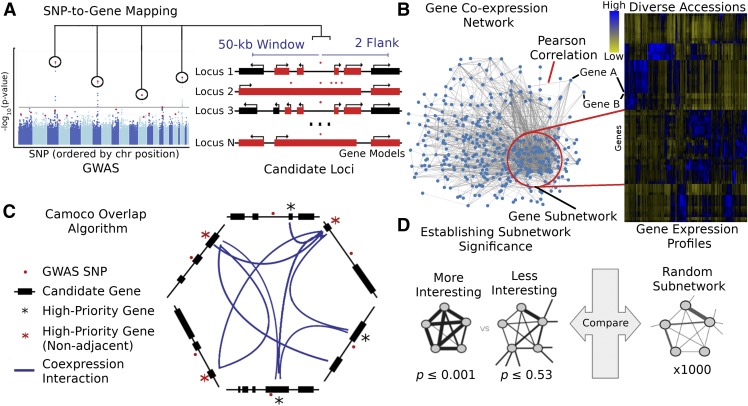
Figure 1.
Schematic of the Camoco Framework.
The Camoco framework integrates genes identified by SNPs associated with complex traits with functional information inferred from coexpression networks.
(A) A typical GWAS result for a complex trait identifies several SNPs (circled) passing the threshold for genome-wide significance indicating a multigenic trait. SNP-to-gene mapping windows identify a varying number of candidate genes for each SNP. Candidate genes are identified based on user-specified window size and a maximum number of flanking genes surrounding an SNP (e.g., 50 kb and two flanking genes, designated in red).
(B) Independently, gene coexpression networks identify interactions between genes uncovering an unbiased survey of putative biological cofunction. Network interactions are identified by comparing gene expression profiles across a diverse set of accessions (e.g., experimental conditions, tissue, and samples). Gene subnetworks indicate sets of genes with strongly correlated gene expression profiles.
(C) Coanalysis of coexpression interactions among GWAS trait candidate genes identifies a small subset of genes with strong network connections. Blue lines designate genes that have similar coexpression patterns indicating coregulation or shared function. Starred genes are potential candidate genes associated with GWAS traits based on SNP-to-gene mapping and coexpression evidence. Red stars indicate genes that are not the closest to the GWAS SNP (nonadjacent) that may have been missed without coexpression evidence.
(D) Statistical significance of subnetwork interactions is assessed by comparing coexpression strength among genes identified from GWAS data sets with those from random networks containing the same number of genes. In the illustrated case, the more interesting subnetwork has both high density and locality.

