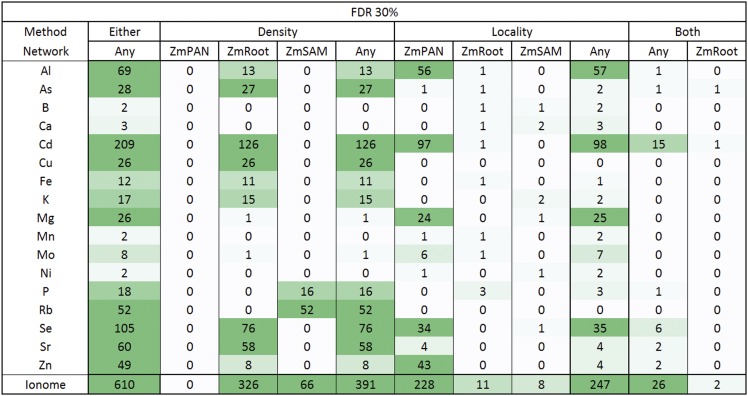
Figure 6.
Maize Grain Ionome High-Priority Candidate Gene Heat Map Summary.
Gene-specific density and locality metrics were compared with random sets of genes (n = 1000) of the same size to establish a 30% FDR. Genes were considered candidates if they were observed at two or more SNP-to-gene mappings (i.e., HPO). Candidates in the Either column are HPO genes discovered by either density or locality in any network. The number of genes discovered for each element is further broken down by coexpression method (density, locality, and both) and by network (ZmPAN, ZmSAM, and ZmRoot). Candidates in the Both column were discovered by density and locality in the same network or in different networks (Any). The shading of the heat map indicates more HPO genes. Note that zero elements had HPO genes using both methods in the ZmPAN and ZmSAM networks.

