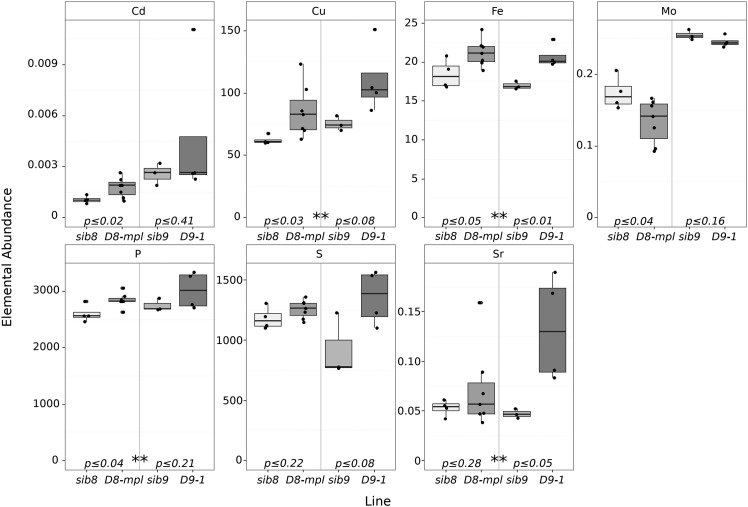
Figure 8.
Ionomic Profiles of D8-mpl and D9-1 Mutants.
Box plots display ICP-MS values for D8-mpl and D9-1 along with congenic wild-type siblings (sib8 and sib9). Embedded P values indicate statistical differences between mutants and wild-type siblings, while asterisks (**) indicate significant differences in a joint analysis between dwarf and the wild type.

