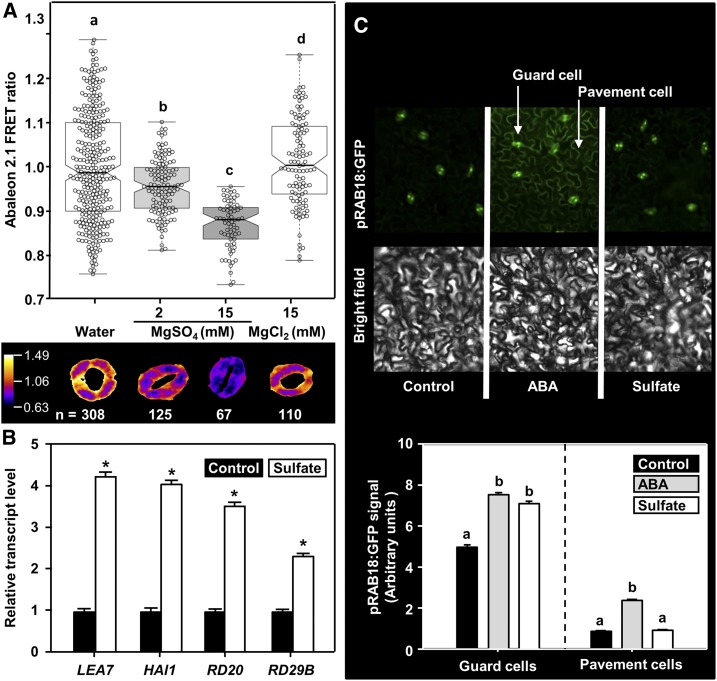
Figure 3.
Sulfate Triggers ABA Production in Guard Cells in a Concentration-Dependent Manner.
(A) The upper panel shows the ABAleon2.1 emission ratio. Signals from guard cells treated with water alone (n = 308), or water supplemented with 2 mM MgSO4 (n = 125), 15 mM MgSO4 (n = 67), or 15 mM MgCl2 (n = 110), respectively. Average ABAleon2.1 emission ratio is calculated per stomatal area. Statistical tests are performed with respect to the water control. The lower panel shows a representative stoma in the given treatment. Letters indicate statistically significant differences between groups determined with one-way ANOVA (P < 0.05).
(B) Transcript levels of ABA-responsive genes in sulfate-treated epidermal peels. Epidermal peels were collected from 5-week-old wild-type plants and incubated on water supplemented without (black) or with 2 mM MgSO4 (white, sulfate) for 3 h. RNA was extracted and the steady-state transcript levels of ABA-marker genes (LEA7, HAl1, RD20, and RD29B) were quantified by RT-qPCR. The transcript levels of respective genes from water-treated samples were set to 1. Data represent mean ± sd (n = 3). Asterisks indicate statistical significant differences as determined with the Student’s t test (*P < 0.05).
(C) Impact of petiole-fed ABA or sulfate on the expression of the ABA signaling marker ProRAB18:GFP in detached leaves. Leaves of 25-day-old soil grown ProRAB18:GFP plants were detached and fed via the petiole with ABA (gray, 50 μM) or sulfate (white, 15 mM MgSO4) dissolved in water (black, Control) for 180 min before quantification of the GFP signal. The upper panel displays a representative image of the epidermis containing guard and pavement cells. Bright field image of the same area is shown for orientation. The lower panel depicts the quantification of GFP-signal intensities in guard- or pavement cells after the treatment. Data represent mean ± se (guard cells: n = 666 for water, n = 534 for sulfate, n = 894 for ABA, from five individual leaves, pavement cells n = 20 regions of interest containing multiple pavement cells for each treatment, from five individual leaves).
Letters indicate statistically significant differences between groups determined with one-way ANOVA (P < 0.05).

