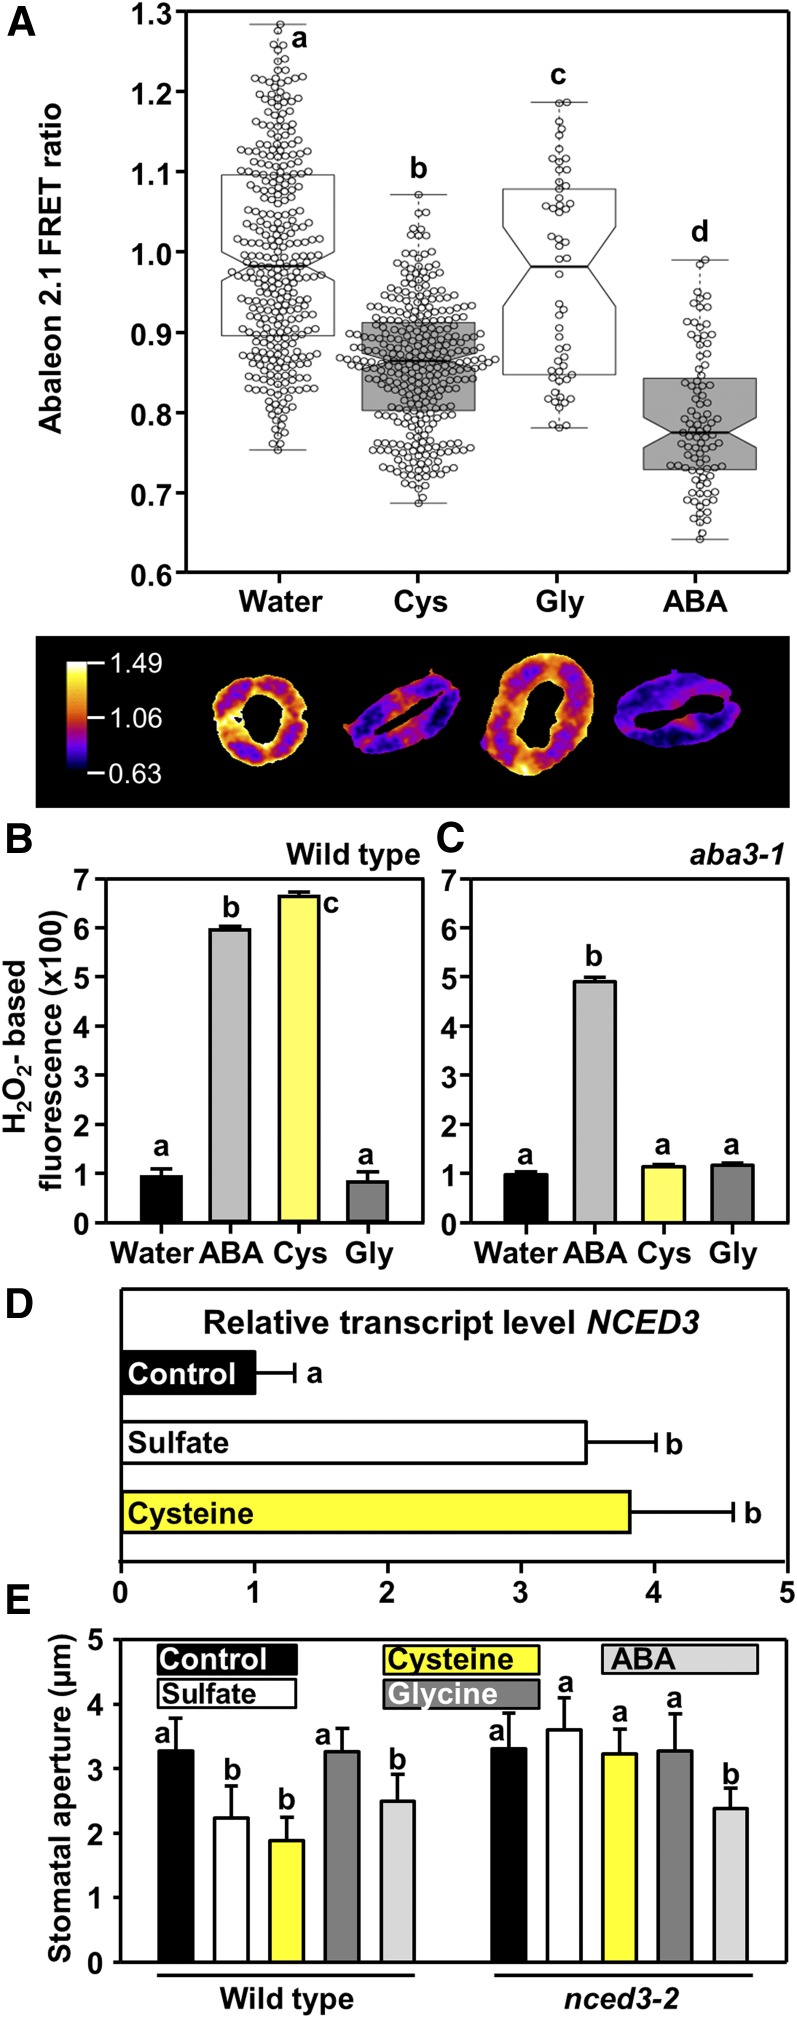
Figure 7.
Exogenous Application of Cys Induces ABA Production in Guard Cells and ROS Formation in an ABA3-Dependent Manner.
(A) The upper panel shows the ABAleon2.1 emission ratio, calculated from guard cells treated with only water (n = 308), 500 μM Cys (n = 311), 500 μM Gly (n = 54), or 50 μM ABA (n = 91), respectively. The average ABAleon2.1 emission ratio is calculated per stomatal area. Statistical tests are performed with respect to the water control. The lower panel shows a representative stomata subjected to the treatment indicated in the x axis label above.
(B) and , (C) Impact of ABA (light gray, 50 μM), Cys (yellow, 0.5 mM), or Gly (dark gray, 0.5 mM) on hydrogen peroxide production in guard cells of wild type (B) and aba3-1 (C) as measured by H2DCF-DA staining. Data represent mean ± sd in (n = 50, derived from ≥5 individual plants).
(D) and (E) Impact of sulfate (white, 15 mM), Cys (yellow, 0.5 mM), Gly (dark gray, 0.5 mM), or ABA (light gray, 50 μM) on transcript levels of NCED3 in leaves of the wild type (D) and stomatal aperture of the wild type and the nced3-2 mutant (E). Data represent mean ± sd (n = 50, derived from ≥5 individual plants for stomatal closure, n = 3 for determination of transcript levels).
Letters indicate statistically significant differences between groups determined with one-way ANOVA (P < 0.05).

