
Figure 5.
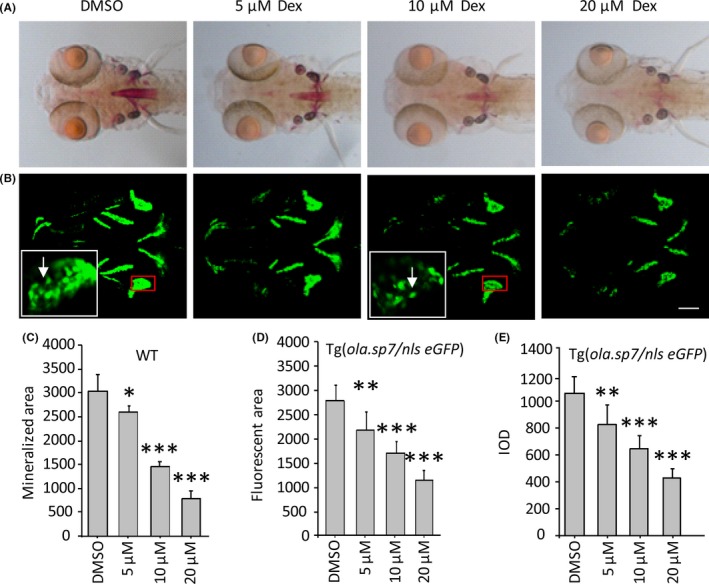
Dex induces OP‐like symptom in both wild‐type and Tg(ola.sp7:nlsGFP) zebrafish. (A), Dex‐treated larvae were stained by alizarin red. The stained area show the level of bone mineralization which is decreased in a dose‐dependent manner of Dex concentration from 0 to 20 μM (D). (B), 3D‐reconstructed confocal images of Dex‐treated Tg(ola.sp7:nlsGFP) zebrafish. Bone mass and density are reflected by GFP area and integrated optical density, which also presented a dose‐dependent manner of Dex concentration from 0 to 20 μM (E, F). Images in white frames are 5× magnifications relative to the red insets, where osteoblasts are visible (white arrow). Data are presented as means ± SD; *P < .05; **P < .01; ***P < .001; n = 18 fish in each group; scale bar, 100 μm