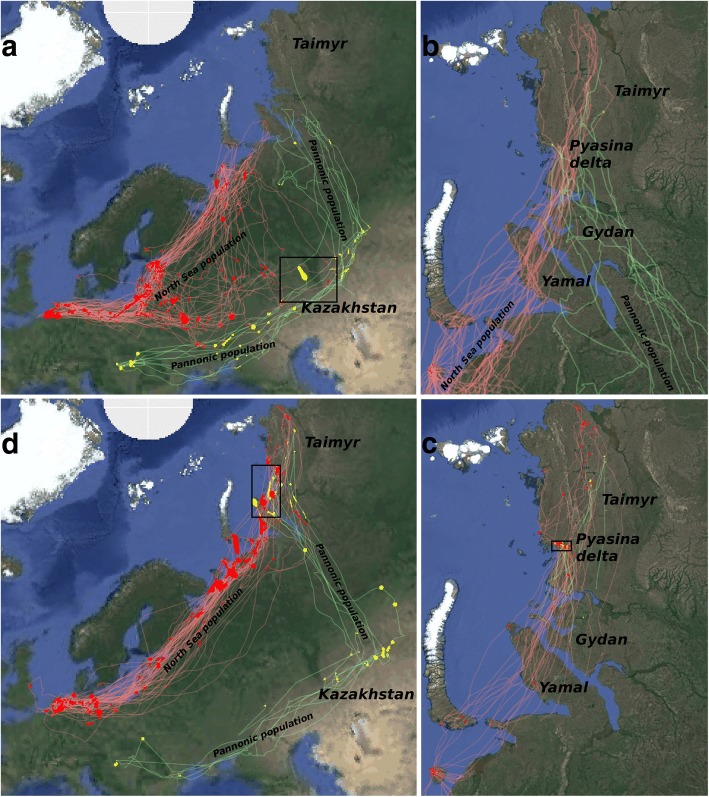
Fig. 1.
GPS movement tracks of geese from the North Sea population (red lines) and Pannonic population (green lines) with dynamic Brownian bridge utilisation distribution cells of stopover, nest and moult sites (red cells for North Sea population, yellow cells for Pannonic population). Clockwise: (a) Spring migration tracks and stopovers, (b) nesting sites with tracks of 15 May – 15 July, (c) moulting sites with tracks of 1 July – 1 September and (d) autumn migration tracks and stopovers. Outlines are of overlap regions (see Fig. 2). Note that there is no overlap of nesting sites (North Sea population: Kolguev – Yamal; Pannonic population: Gydan and Taimyr). Tracks during moult (c) are not clearly separated by population

