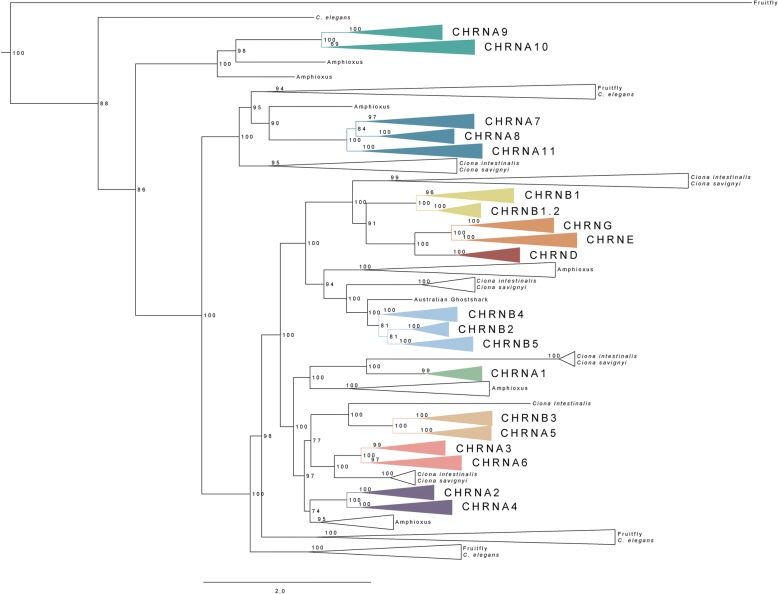
Fig. 1.
Phylogenetic maximum likelihood tree of the nAChR genes, rooted with the human 5HTR3A and 5HTR3B; the root is not displayed. The collapsed nodes represent the orthologs of the respective nAChR genes, where each color code corresponds to one nAChR gene subfamily. The invertebrate chordate (represented by amphioxus and tunicates) and protostome (represented by C. elegans and fruitfly) closest homologs are shown as non-colored nodes. The tree topology is supported by a non-parametric Ultra-Fast Bootstrap (UFBoot) analysis

