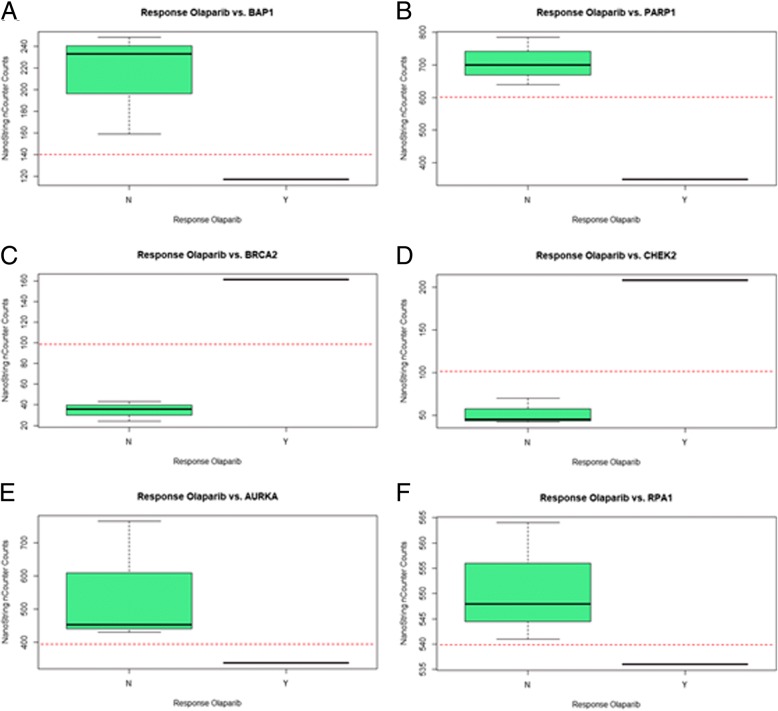
Fig. 3.
Comparison of significant differences in gene expression level between cell lines with respect to response to treatment with olaparib. Red dotted lines were placed and may represent thresholds between gene expression patterns leading to response to olaparib treatment or not. a: BAP1 was rarely expressed in the cell line that showed response to olaparib treatment (NCI H2452), while it was expressed in other cell lines that showed no response (160 to 250 counts). Threshold was set at 140 counts. b: PARP1 was expressed in NCI H2452 with 350 counts, but other cell lines showed significantly higher expression patterns with 640–785 counts. Threshold was set at 600 counts. c/d: BRCA2 and CHEK2 are expressed in the cell line that showed response to olaparib (NCI H2452), while no expression was detected in cell lines that showed no response. Thresholds were set at 100 counts for BRCA2 and CHEK2. e/f: AURKA and RPA1 are more expressed in cell lines that showed no response, than in NCI H2452. Thresholds were set at 400 counts for AURKA and 540 counts for RPA1

