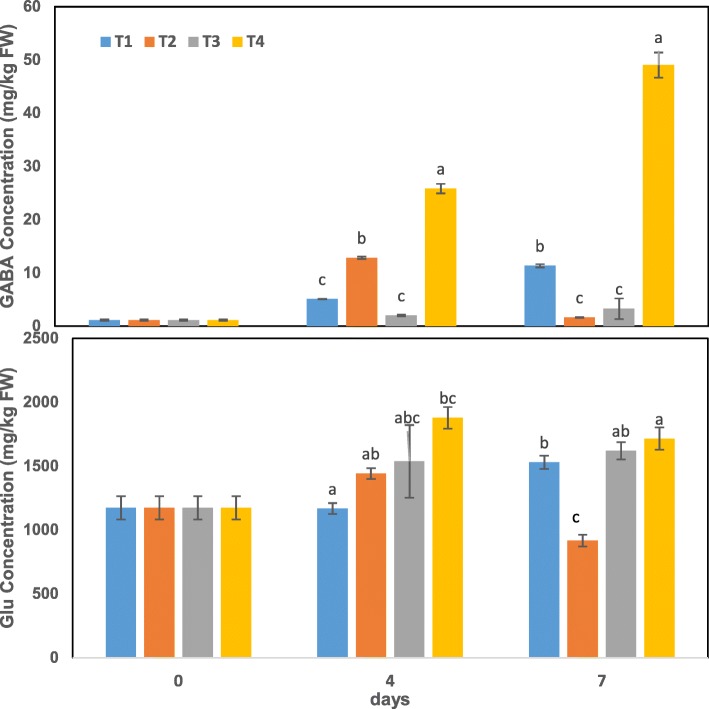
Fig. 1.
Changes in endogenous GABA and glutamate contents during treatments T1–T4 (25 °C, 25 °C + GABA, 4 °C and 4 °C + GABA for T1, T2, T3 and T4, respectively). Data represent the mean value ± standard deviation. Means with different letters significantly differ from each other (p ≤ 0.05). Glu, glutamate

