Fig. 5.

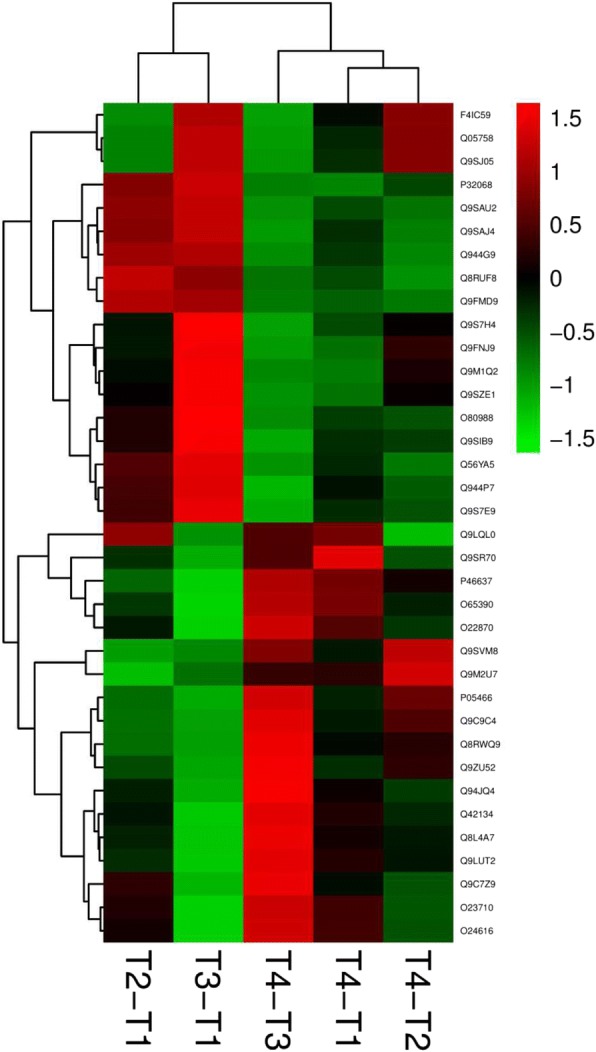
Clustering analysis for DAPs in amino acid transport metabolism in tea leaves after exposure to treatments T2/T1, T3/T1, T4/T1, T4/T2 and T4/T3 for 7 days (25 °C, 25 °C + GABA, 4 °C and 4 °C + GABA for T1, T2, T3 and T4, respectively)

Clustering analysis for DAPs in amino acid transport metabolism in tea leaves after exposure to treatments T2/T1, T3/T1, T4/T1, T4/T2 and T4/T3 for 7 days (25 °C, 25 °C + GABA, 4 °C and 4 °C + GABA for T1, T2, T3 and T4, respectively)