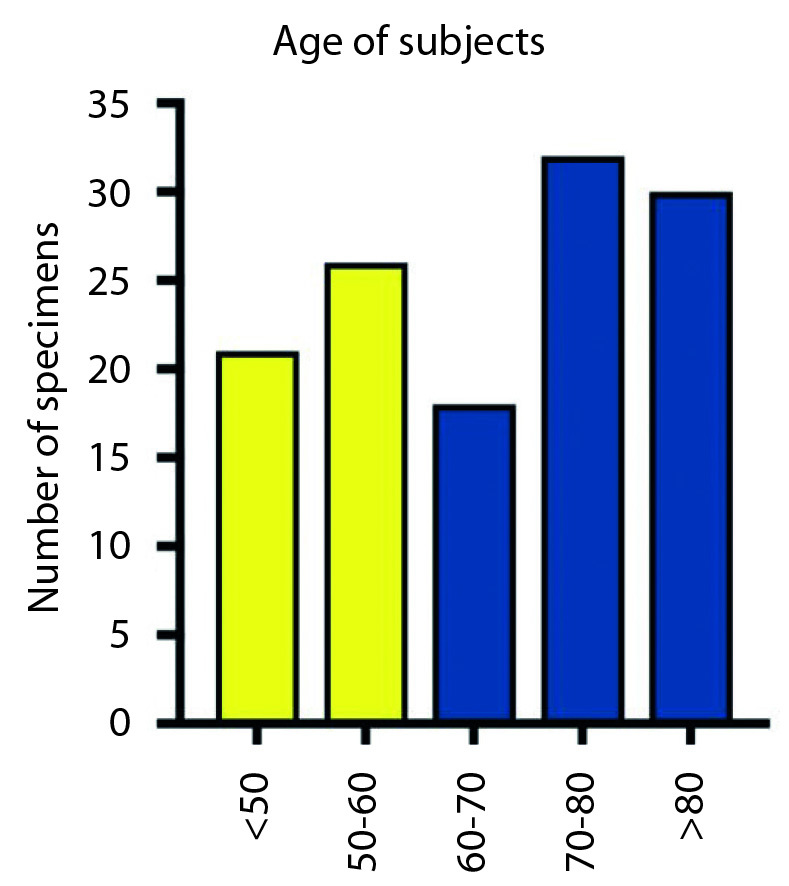
Figure 4.

Age distribution in the overall sample; the yellow bars indicate the number of subjects with age <60 years, and the blue the subjects with age >60 years. The subjects were divided by decades to facilitate the understanding of sample age distribution.
