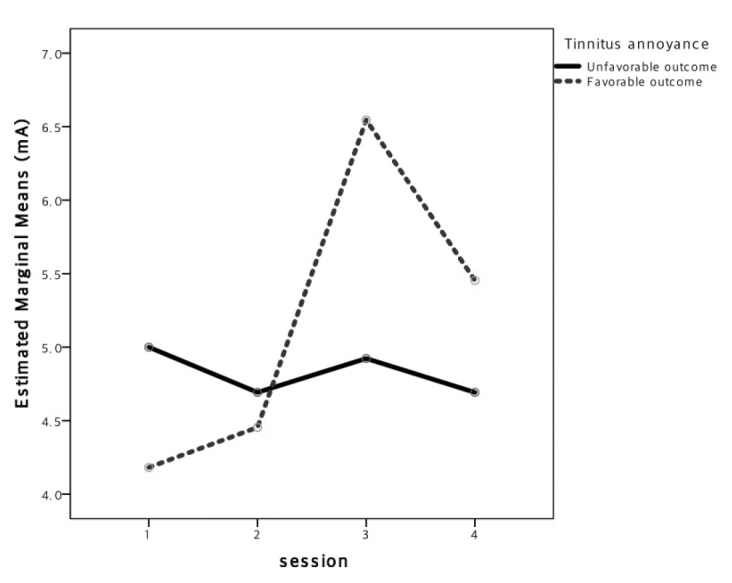
Figure 3.

Differences in the stimulus intensity across sessions, according to treatment response. The x-axis refers to multiple sessions and the y-axis refers to mean maximal sensory thresholds. For tinnitus annoyance, a small increasing trend in the stimulus intensity at the cavum was observed in the responders but not in non-responders; the difference was statistically significant (p=0.006).
