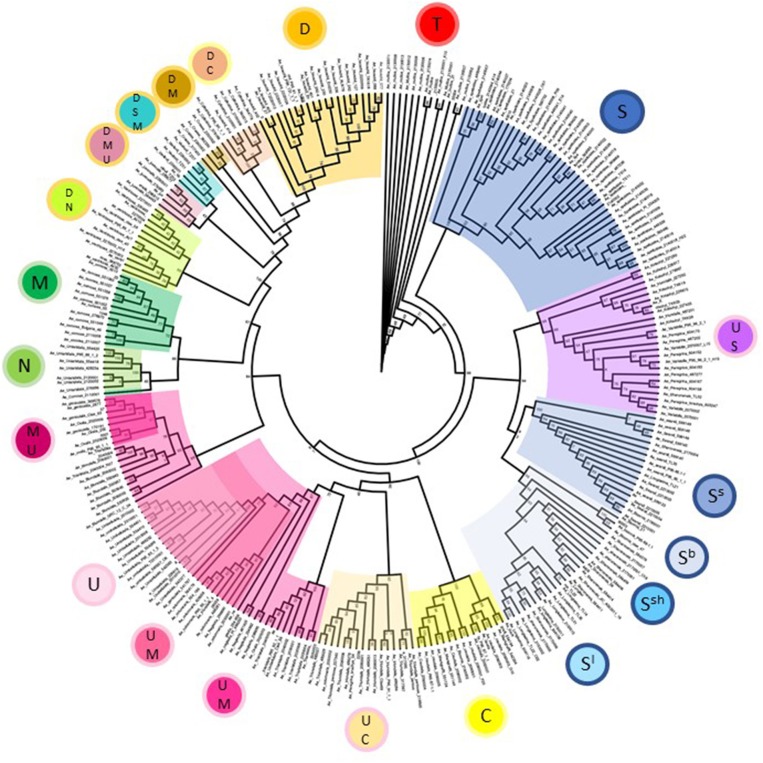
Figure 3.
Phylogeny of Aegilops accessions used in the study based upon a maximum likelihood tree generated using all genotype data. Bootstrap support values are given at branch points and are based upon 10,000 replicates. Clades are colored according to genome designations given in the inner circles in Figure 1.

