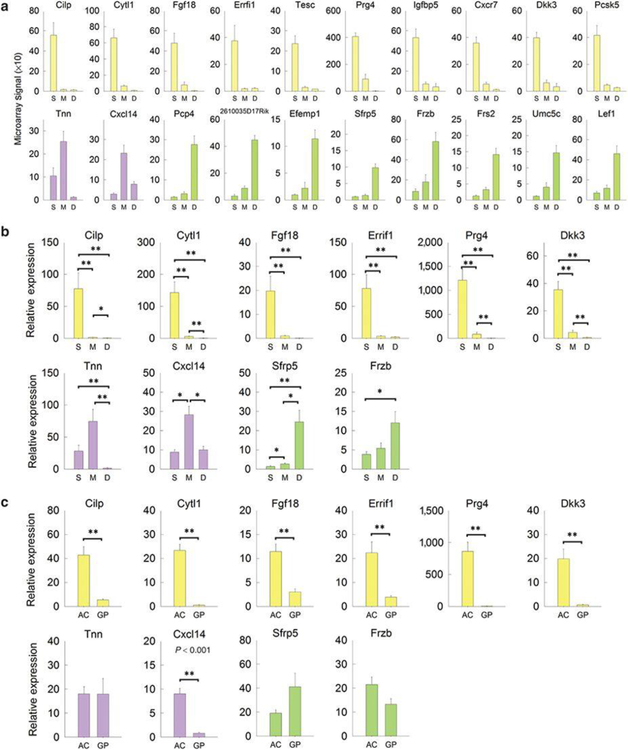
Figure 3. Differential gene expression (mean±SEM) of potential spatial markers across the tibial articular cartilage of 1-week old mice.
Different zones were isolated by laser capture microdissection and expression of potential spatial markers (yellow bars, superficial zone markers; purple bars, middle zone markers; green bars, deep zone markers) were analyzed by microarray (A) and real-time PCR (B). P-values in (B) represent pairwise comparison with Holm-Sidak correction following one-way ANOVA. To compare gene expression between overall articular cartilage and growth plate cartilage, manual microdissection of both regions from proximal tibias of 1-wk old mice was performed followed by real-time PCR (C). P-values in (C) represent t-test, articular cartilage versus growth plate cartilage. S, superficial zone; M, middle zone; D, deep zone; AC, articular cartilage; GP, growth plate cartilage.

