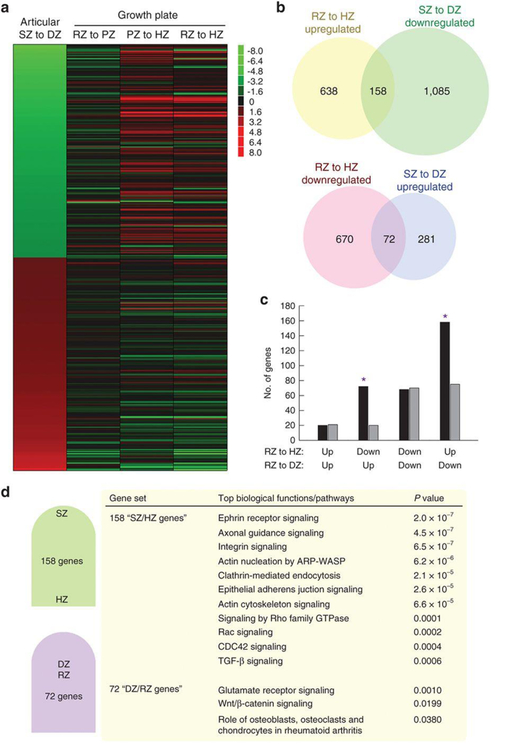
Figure 5. Comparison of spatial regulation of gene expression in articular and growth plate cartilage.
Our current zonal analysis of 1-wk old tibial mouse articular cartilage was combined with our previous zonal analysis of 1-wk old tibial rat growth plate cartilage (26). (A) Heat maps were constructed for the 200 genes that were most strongly upregulated and 200 genes that were most strongly downregulated from SZ to DZ of articular cartilage. Red color represents upregulation, green color represents downregulation. Genes downregulated from SZ to DZ (green) tended to be upregulated from RZ to HZ (red), and vice versa. (B) Venn diagrams showing the overlap between RZ-to-HZ upregulation and SZ-to-DZ downregulation, and also the overlap between RZ-to-HZ downregulation and SZ-to-DZ upregulation. Numbers on Venn diagram indicate number of genes in each category. Significant regulation was defined as ≥ 2-fold and FDR < 0.05. (C) Observed (black bars) and expected (grey bars) overlap of RZ-to-HZ regulation in growth plate and SZ-to-DZ regulation in articular cartilage. Asterisks indicate observed overlap greater than expected by chance (P<0.001, Pearson’s chi-square test). (D) Ingenuity Pathway Analysis of the 158 that were both significantly upregulated from RZ to HZ, and also downregulated from SZ to DZ genes (“SZ/HZ genes”) and the 72 genes that were both significantly downregulated from RZ to HZ, and also upregulated from SZ to DZ (“DZ/RZ genes”). For SZ/HZ genes, the top 10 biological functions with the lowest p-value were listed. For DZ/RZ genes, all functions with P<0.05 were listed. SZ, superficial zone; MZ, middle zone; DZ, deep zone; RZ, resting zone; PZ, proliferative zone; HZ, hypertrophic zone.

