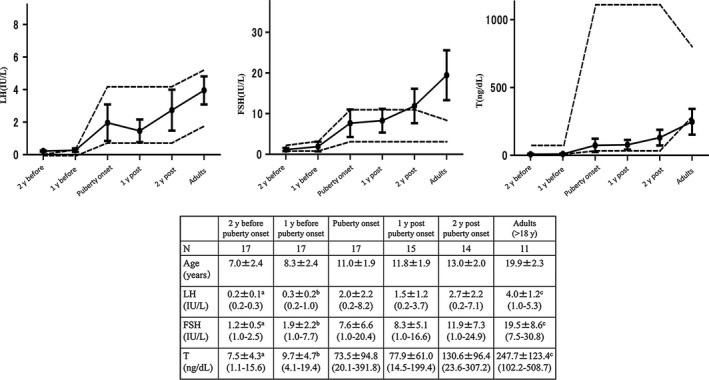
Figure 1.

Longitudinal changes of the average values of serum LH, FSH and testosterone (T) levels in PWS males. The black dots represent the mean values of each age with the error bars representing 95% confidence intervals for the mean. The 5th to 95th percentiles of normal reference values for LH, FSH and testosterone levels are indicated by dotted lines. aThe values in the group at 2 y before puberty onset differed significantly from the values in the group at puberty onset for LH, P < 0.009; FSH, P < 0.001; and T, P < 0.0001. bThe values in the group at 1 y before puberty onset differed significantly from the values in the group at puberty onset for LH, P < 0.005; FSH, P < 0.001; and T, P < 0.0001. cThe values in the group at adults differed significantly from the values in the group at puberty onset for LH, P < 0.005; FSH, P < 0.001; and T, P < 0.0007
