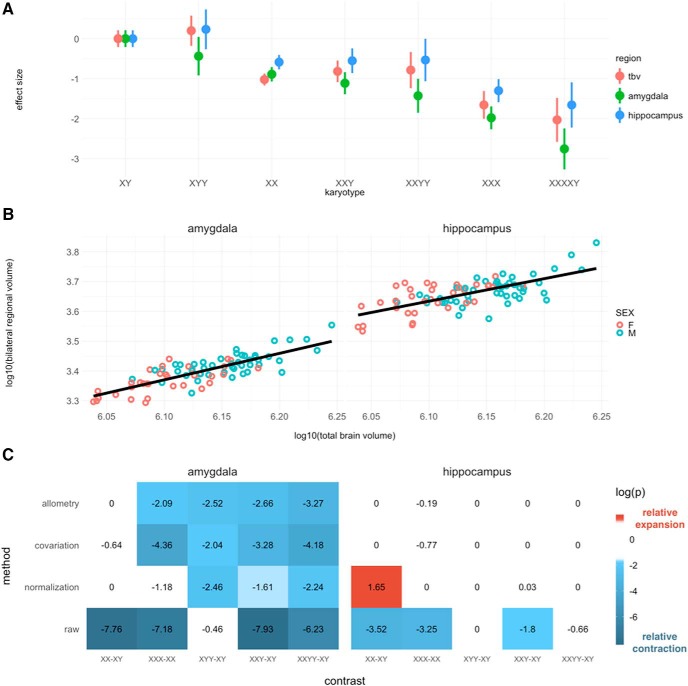
Figure 1.
Bulk volume analysis of amygdala and hippocampus. (A) Total brain volume (tbv), amygdala, and hippocampus volume across karyotype groups, relative to typically developing males (XY). (B) Scaling of amygdala and hippocampus volume in the allometric sample (amygdala β1 = 0.89; hippocampus β1 = 0.76). (C) Comparisons of regional volume across sex and sex chromosome complement. FDR-corrected log(p) values are shown. Presence of color indicates statistical significance, and color identity/sign indicates direction of effect: for contrast A-B, blue and negative values indicate smaller volume in A versus B, red and positive value indicate larger volume in A versus B.

