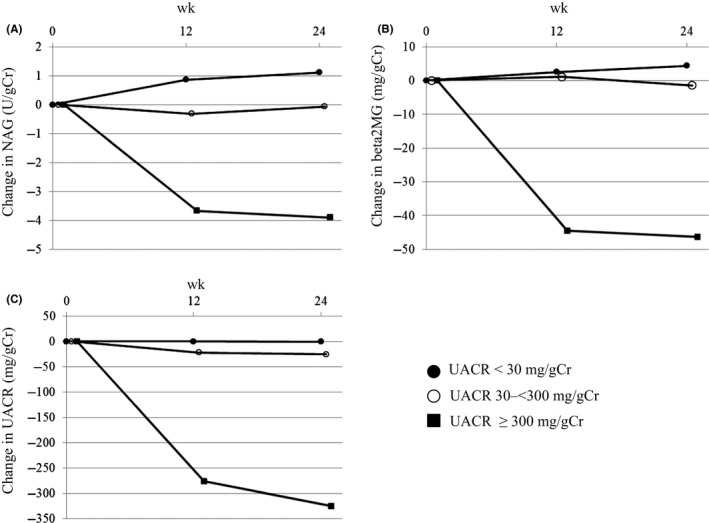
Figure 2.

The process of the change in tubular indices and the urine albumin‐to‐creatinine ratio (UACR) in each group. A, N‐acetyl‐beta‐d‐glucosaminidase (NAG), (B) Beta‐2 microglobulin (beta2MG), (C) UACR. ●: UACR <30 mg/gCr, ○: UACR 30‐<300 mg/gCr, ■: UACR ≥300 mg/gCr, Median
