
Figure 1.
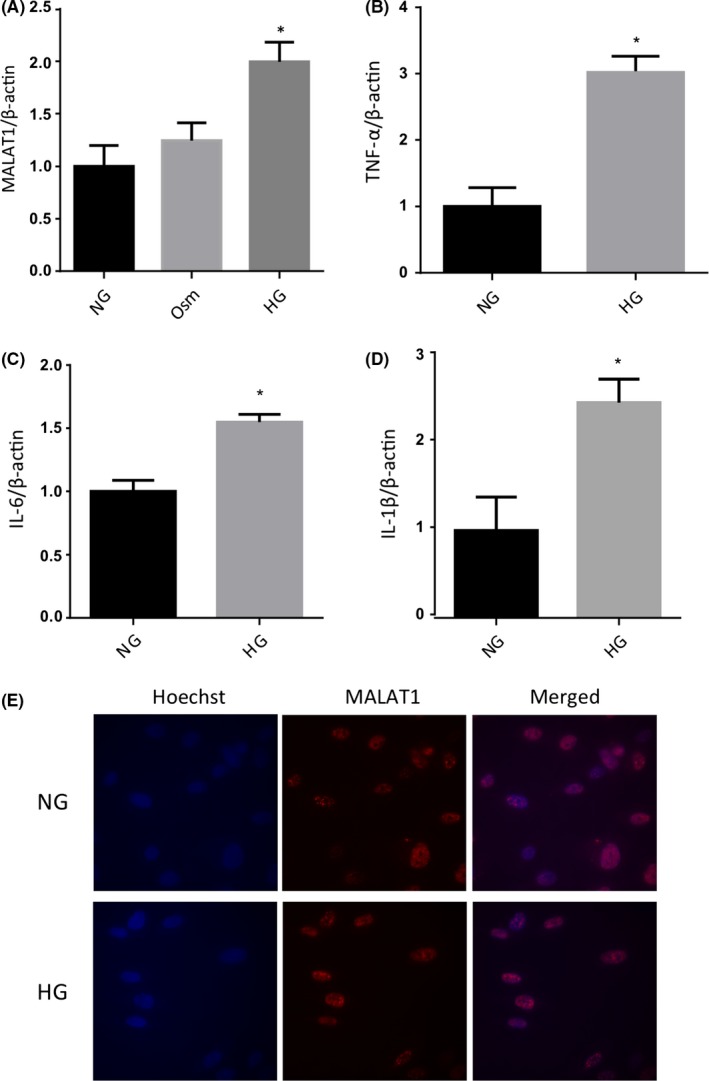
qRT‐PCR and FISH analyses in human retinal microvascular endothelial cells. Real‐time reverse transcription PCR analysis showing 25 mmol/L glucose (HG) induced upregulation of (A) MALAT1 transcript and (B‐D) pro‐inflammatory cytokine (TNF‐α, IL‐6 and IL‐1β) transcripts in endothelial cells compared to 5 m mmol/L glucose (NG) at 48 hours. No changes were seen following incubation with 25 m mmol/L l‐glucose (osmotic control, Osm). E, Fluorescent in situ hybridization, using MALAT1‐specific probes (red), confirmed MALAT1's localization to nuclear speckles without any demonstrable glucose‐induced changes in the subcellular distribution [data expressed as mean ± SEM; normalized to NG, *=P < .05 compared to NG; experiment performed in triplicate from 3 independent experiments; Hoechst (blue) counterstain; original magnification, 60×]