
Figure 3.
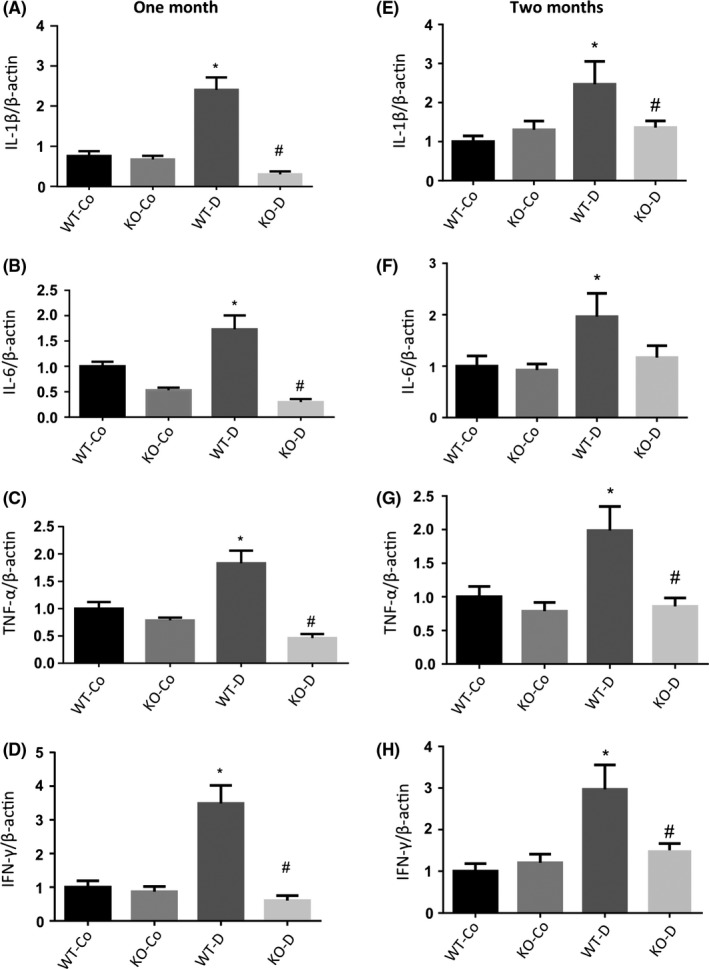
qRT‐PCR analysis of inflammatory markers in mice hearts at 1 and 2 months. Real‐time reverse transcription PCR analysis of the hearts from WT control (WT‐Co), WT diabetic (WT‐D), MALAT1−/− control (KO‐Co) and MALAT1−/− diabetic (KO‐D) mice at 1 (left panel) and 2 months (right panel) showed upregulations of (A,E) IL‐1β; (B,F) IL‐6; (C,G) TNF‐α and (D,H) INF‐γ in WT diabetic animals. Loss of MALAT1 prevented such increases in the diabetic KO group (KO‐D). No changes in normal glucose expression were observed in the KO‐Co animals (*P < .05 compared to WT‐Co, #P < .05 compared to WT‐D; n = 6/group; data expressed as mean ± SEM; normalized to β‐actin; and expressed as a fold change in WT‐Co)