
Figure 4.
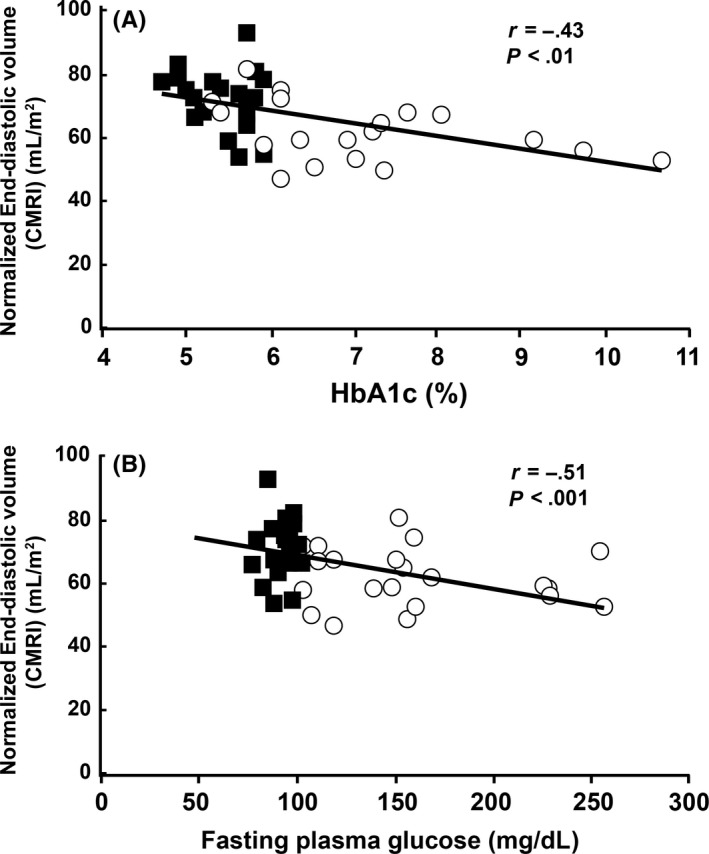
A, The normalized end‐diastolic volumes measured with CMRI were significantly and negatively correlated with HbA1c (ρ = −.59, P = 7 × 10⁻⁵) and B, with fasting plasma glucose (ρ = −.42, P < .01). Blue squares indicate NGT subjects and red circles indicate T2DM subjects