FIG 1.
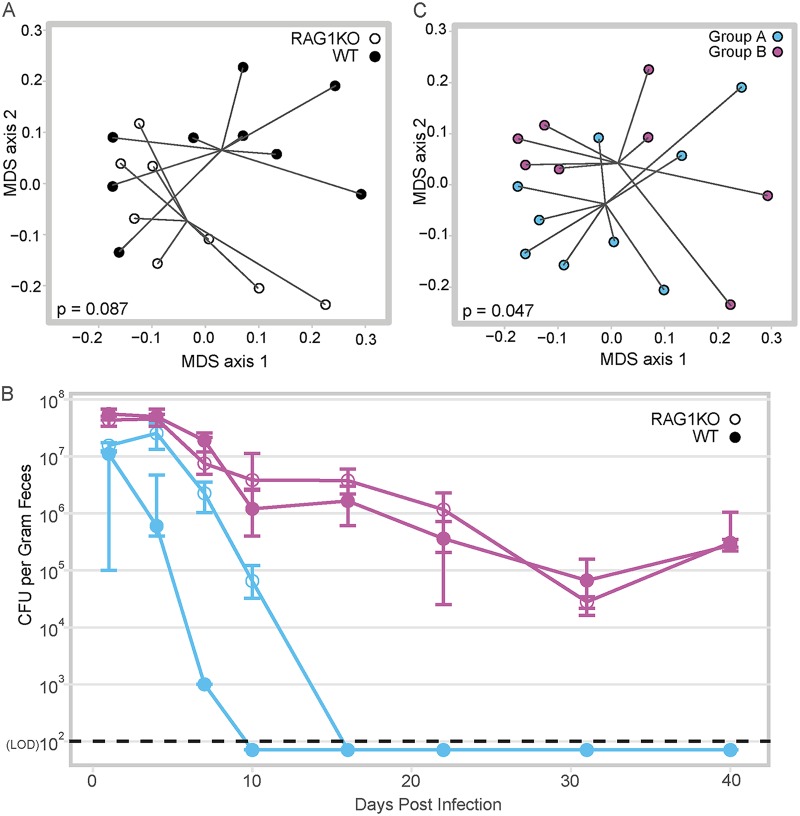
Adaptive immunity is not required for clearance of C. difficile. (A) Multidimensional scaling (MDS) plot of Bray-Curtis dissimilarity between the fecal microbiota of WT mice versus RAG1−/− mice during cohousing, before antibiotic pretreatment. Each circle represents the fecal microbial community from one mouse. Closed circles depict WT mice, while open circles depict RAG1−/− (RAG1 knockout [RAG1KO]) mice; the communities are not significantly different by ANOSIM (P = 0.087). (B) Temporal C. difficile colonization by cage. The circles indicate the median level of colonization within a cage, while the bars indicate the interquartile ranges. Groups of mice that were cohoused together are denoted by shared color; closed circles are WT mice, while open circles are RAG1−/− mice. Day 40 colonization was used to determine whether C. difficile CFU/g feces was statically different between the groups (purple WT versus purple RAG1−/− P = 0.886, purple WT versus blue RAG1−/− P = 0.026, purple RAG1−/− versus blue RAG1−/− P = 0.026, purple RAG1−/− versus blue WT P = 0.026, purple WT versus blue WT P = 0.026). The LOD was 100 CFU/g feces. In cases where no CFU were detected, results are plotted below the LOD for visual clarity, while a value equal to the was used for statistical tests. Statistical significance was calculated using a Wilcoxon test with Benjamini-Hochberg correction for multiple comparisons. (C) MDS plot of Bray-Curtis dissimilarity of WT versus RAG1−/− mice during cohousing, before antibiotic pretreatment, analyzed by cohousing group rather than genotype. Each circle represents the fecal microbial community from one mouse; the mice that will go on to clear C. difficile are indicated with blue circles versus mice that will remain colonized indicated with purple circles (ANOSIM, P = 0.047).

