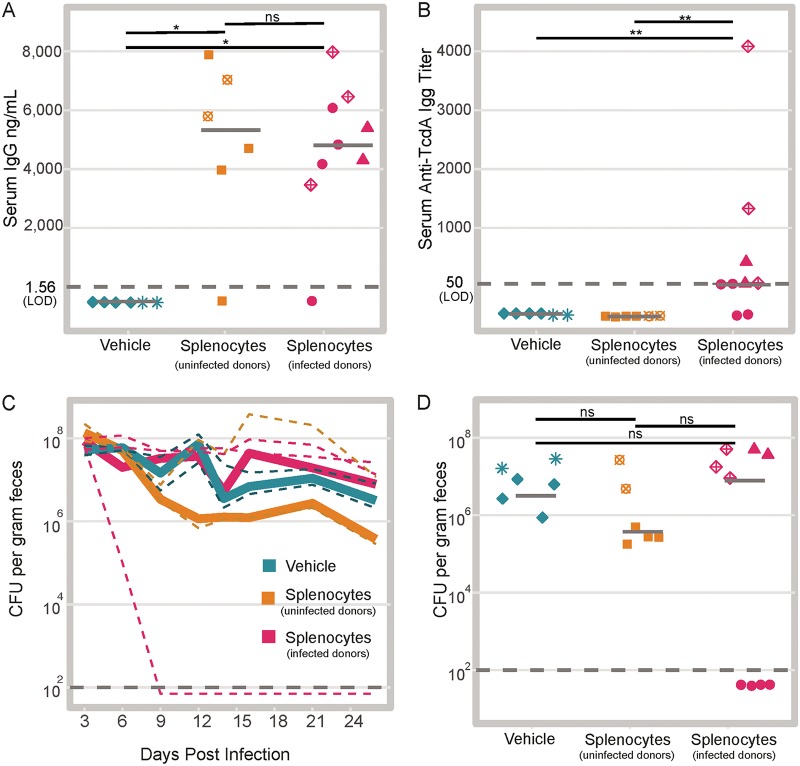
FIG 2.
Adoptive transfer of WT splenocytes into RAG1−/− mice is not sufficient to promote clearance. (A) Total serum IgG in the recipient RAG1−/− mice 24 days after injection of splenocytes (mice that received vehicle versus uninfected donor splenocytes P = 0.014; mice that received vehicle versus infected donor splenocytes P = 0.011; mice that received uninfected donor splenocytes versus infected donor splenocytes P = 0.814). Shapes represent mice in the same cage. Note two mice that were given splenocytes did not develop detectable serum IgG. Each symbol represents the value for an individual mouse. Solid gray lines represent the median values for groups. ns, not significant. (B) Anti-TcdA IgG titers in recipient RAG1−/− mice 24 days after transfer of splenocytes (mice that received vehicle versus infected donor splenocytes P = 0.008; mice that received vehicle versus uninfected donor splenocytes P = not significant; mice that received uninfected donor splenocytes versus infected donor splenocytes P = 0.008). Solid gray lines represent the medians. (C) Time course of intestinal colonization levels with C. difficile colored by treatment group. Solid lines represent the median values (CFU of C. difficile per gram of feces) for treatment groups. Dashed lines represent median colonization values within cages. (D) Colonization on day 26 postinfection (day 24 after adoptive transfer) colored by treatment group (mice that received vehicle versus uninfected donor splenocytes P = 0.689; mice that received vehicle versus infected donor splenocytes P = 1; mice that received uninfected donor splenocytes versus infected donor splenocytes P = 1). Solid gray lines represent the median values. The dark gray dashed line in each panel represents the limit of detection (LOD). In cases where no CFU were detected, results are plotted below the LOD for visual clarity, while a value equal to the was used for statistical tests. Statistical significance was calculated using a Wilcoxon test with Benjamini-Hochberg correction for multiple comparisons.

