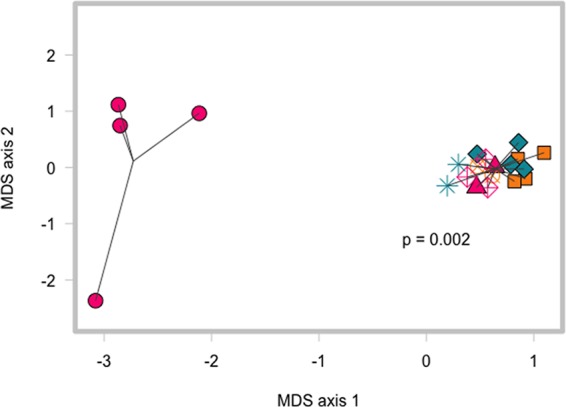
FIG 3.

Clearance of C. difficile colonization is associated with significantly different pretransfer gut microbiota, not treatment groups. Multidimensional scaling (MDS) plot of Bray-Curtis dissimilarity index comparing communities in mice at day 1 postinfection (before adoptive transfer). Cages that cleared infection are shown as pink circles, while the other cages are represented by different shapes (mice that went on to clear C. difficile versus all other mice, ANOSIM P = 0.002).
