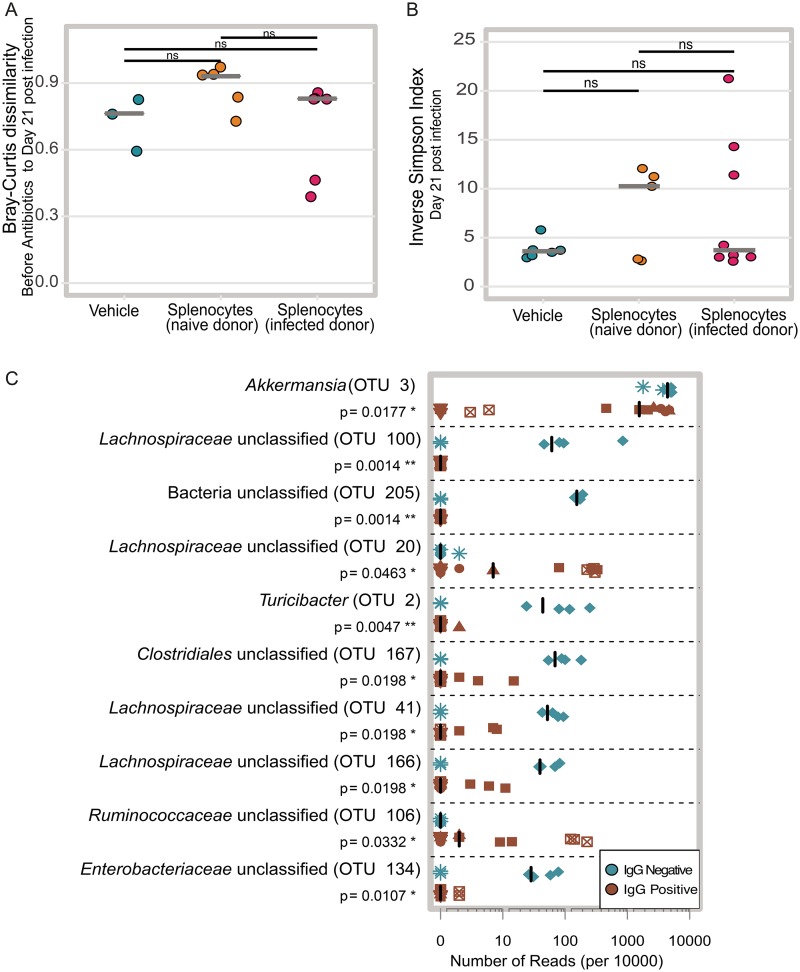
FIG 4.
Effect of reconstitution of adaptive immunity on the microbiota. (A) The Bray-Curtis dissimilarity between each mouse’s preantibiotic and day 21 postinfection communities (mice that received uninfected donor splenocytes versus infected donor splenocytes P = 0.214, mice that received uninfected donor splenocytes versus vehicle P = 0.214, mice that received infected donor splenocytes versus vehicle P = 0.714). Solid gray lines represent the median values for groups. (B) Inverse Simpson diversity of communities day 21 postinfection communities (mice that received uninfected donor splenocytes versus infected donor splenocytes P = 0.9433, mice that received uninfected donor splenocytes versus vehicle P = 0.943, mice that received infected donor splenocytes versus vehicle P = 0.943). Solid gray lines represent the medians. (C) Relative abundance of the top 10 OTUs with the highest LDA distinguishing between vehicle-treated RAG1−/− mice and IgG-positive mice. Each symbol represents the value for a single mouse. The different shapes represent different cages. Solid black lines represent the medians. Statistical significance was calculated using a Wilcoxon test with Benjamini-Hochberg correction for multiple comparisons.

