
FIG 5.
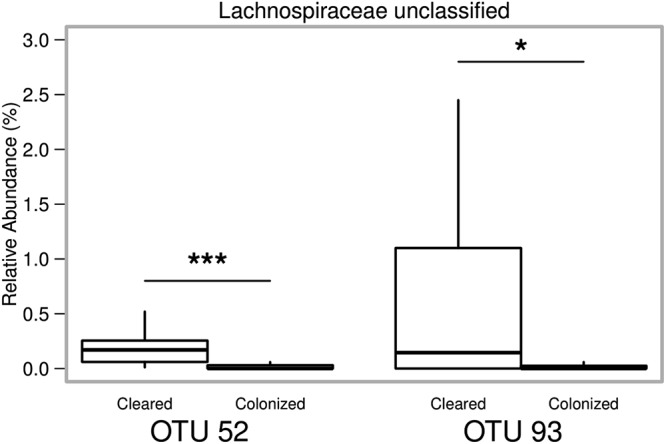
Relative abundance of OTU pretreatment that correctly classify mice that will go on to clear C. difficile infection. Box and whisker plots showing the relative abundance of the two OTUs from the pretreatment fecal microbiota that differentiate animals that will go on to clear C. difficile infection with 66.6% accuracy. Statistical significance was calculated using a Wilcoxon test with Benjamini-Hochberg correction.