. 2018 Nov 10;10(5):1401–1409. doi: 10.1039/c8sc04012e

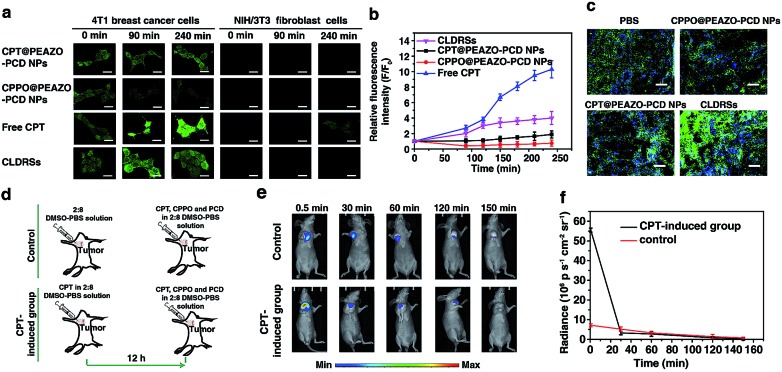
Fig. 3. CPT-induced H2O2 production in tumor cells and tissues to achieve self-enhanced CL. (a) Time-dependent measurements of the H2O2 level using H2O2 probe DCFH-DA (10 μM) in 4T1 tumor cells and 3T3 normal cells with different treatments. Scale bar, 30 μm. (b) Quantitatively relative fluorescence intensity of (a) for 4T1 tumor cells. (c) Ex vivo H2O2 generation intravenous injection of various interventions in tumor measured using DCFH-DA (green) and Hoechst 33342 (blue) staining in tumor sections. Scale bar, 10 μm. (d) Schematic illustration of a mouse bearing a 4T1 tumor treated with CPT for CL imaging. (e) CL images of CPT induction group and control. (f) Quantification of CL intensity for the in vivo images in (e). Error bars indicate the s.d. (n = 3).

Fig. 3