. 2018 Nov 10;10(5):1401–1409. doi: 10.1039/c8sc04012e

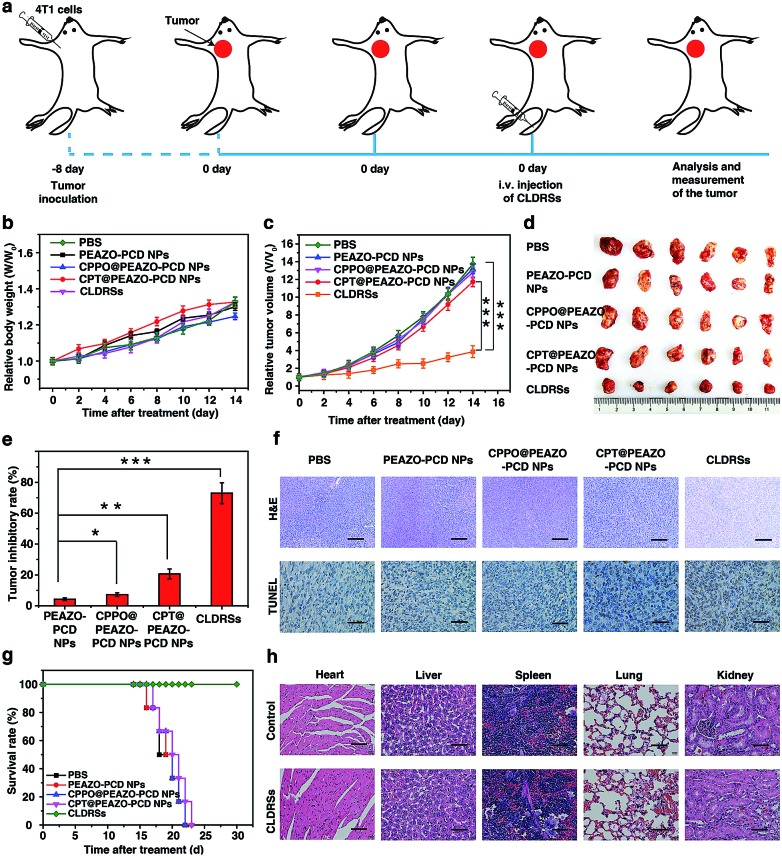
Fig. 5. (a) Schematic illustration of CLDRSs therapy to inhibit tumors. (b) Relative body weight and (c) relative tumor volume growth curves. (d) Representative images of tumor tissues after various treatments, respectively. (e) Tumor-inhibitory-rate after various treatments. Error bars indicate standard deviations of 6 separate measurements. Statistical significance: *P < 0.05; **P < 0.01; ***P < 0.001. (f) Tumors were sectioned and stained with H&E and TUNEL. Scale bar, 100 μm. (g) Survival rates of tumor-bearing mice with different treatments within 30 days. (h) H&E stained images of different organs' tissue sections at 30 days after CLDRSs treatment and the healthy mice as control. Scale bar, 30 μm.

Fig. 5