An official website of the United States government
Here's how you know
Official websites use .gov
A
.gov website belongs to an official
government organization in the United States.
Secure .gov websites use HTTPS
A lock (
) or https:// means you've safely
connected to the .gov website. Share sensitive
information only on official, secure websites.
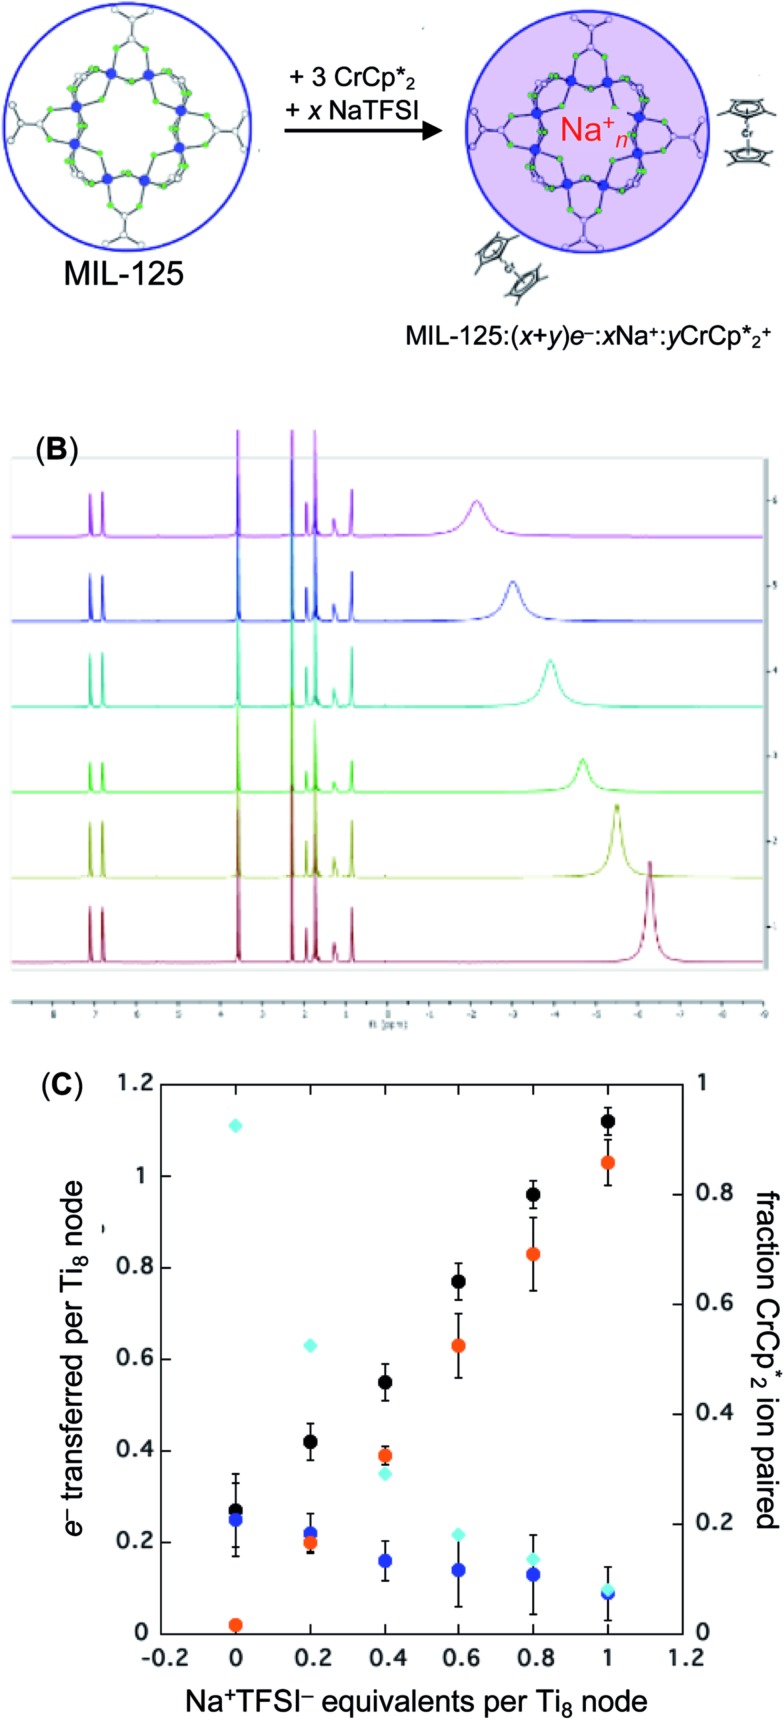
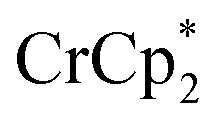 and Na+ (NaTFSI). (A) Schematic of the reaction. (B) 1H NMR spectra (d8-THF + CD3CN 4 : 1 v/v) of mixtures of MIL-125 + 3 equiv.
 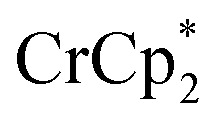 + different equiv. of Na+ per Ti8 node: 0 (red), 0.2 Na+ (yellow), 0.4 Na+ (green), 0.6 Na+ (light blue), 0.8 Na+ (dark blue), and 1.0 Na+ (purple). (C) Plot of e– transferred to MIL-125 (left axis) and fraction of
 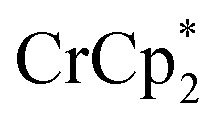 ion-paired in reduced MIL-125 (right axis) versus equiv. NaTFSI added. Orange circles: equiv. of Na+ associated with the reduced MIL-125, derived from the
 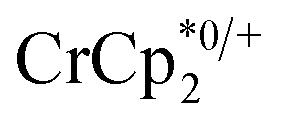 chemical shift. Blue circles: equiv.
 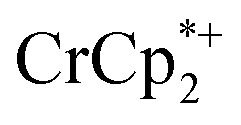 associated with the reduced MIL-125, derived from the change in integration of the
 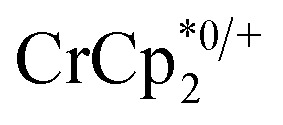 resonance upon mixing with MIL-125. Black circles: total extent of reduction (the sum of the blue and orange circles). Light blue diamonds: fraction of the reduced MIL-125 that is associated with
 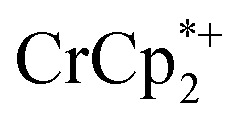 .
.